Running Samples
100 NovoCyte Quanteon Flow Cytometer Operator's Guide
Click the dot plot icon twice to create two new dot plots. Change the X-axis
parameter to be CD3 FITC-H and the Y-axis to be CD8 PE-H for the first dot plot.
Change the X-axis parameter to be CD3 FITC-H and Y-axis to be CD4 APC-H for
the second dot plot. Right-click the name of both plots and select Lymphocyte
from the list to apply the Lymphocyte gate (created in CD45 PerCP-H/SSC-H
density plot) to both plots. Observe the change after application of the gate.
• Compensate the Sample
Use the method described in Perform Fluorescence Compensation in this guide to
apply the compensation matrix created by either automatic compensation or
manual compensation to the sample. Figure 68 and Figure 69 show the data for
the T-Lym sample before and after compensation.
• Statistics
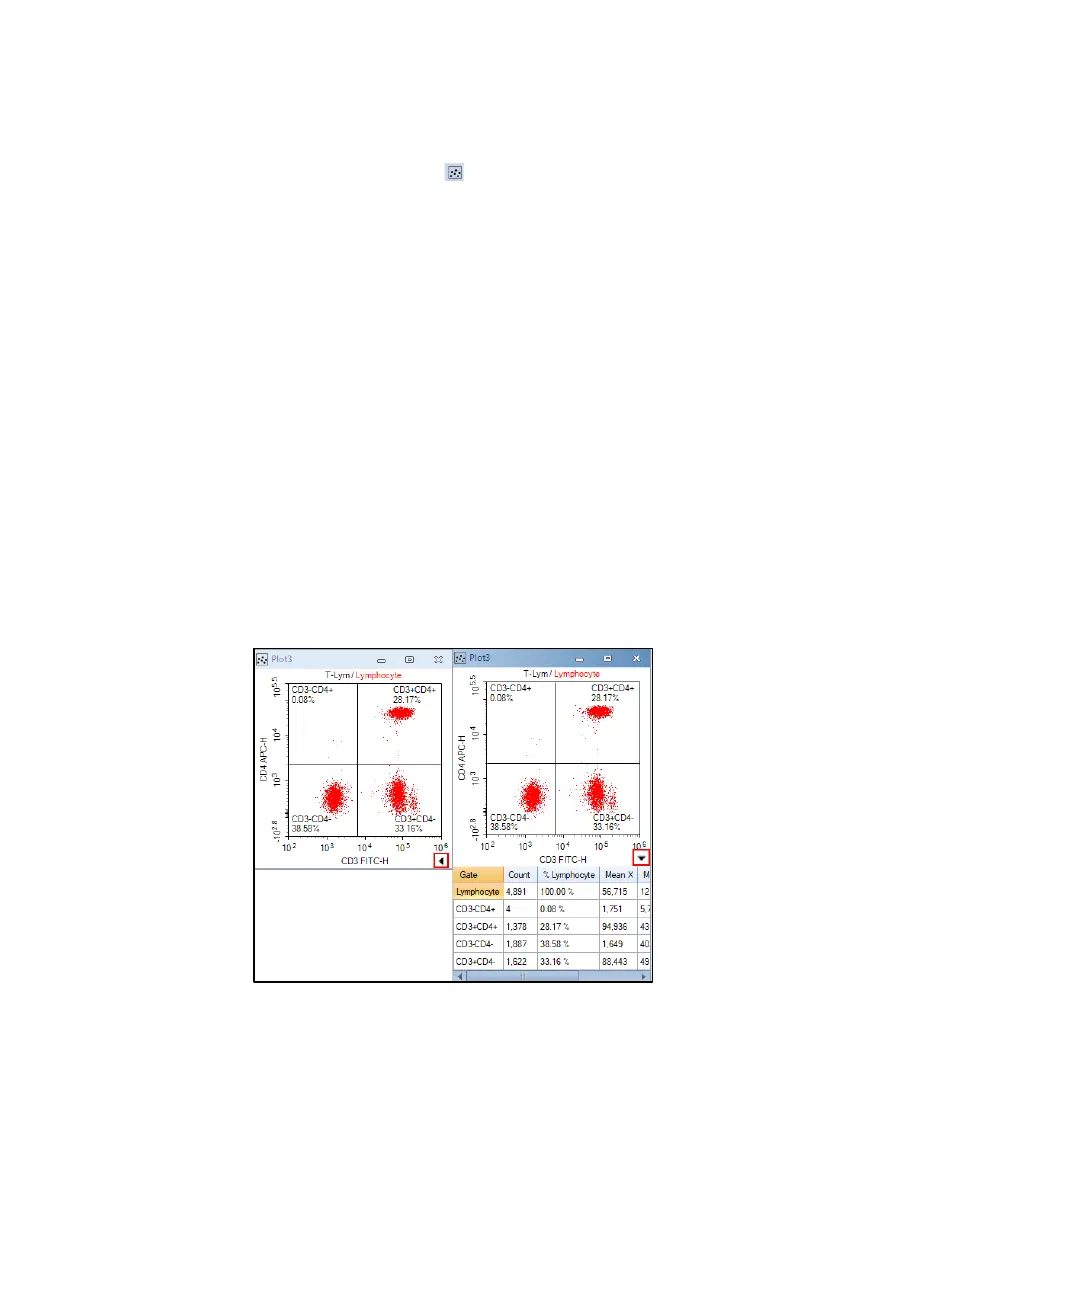
In the CD3 FITC-H/CD8 PE-H and CD3 FITC-H/CD4 APC-H dot plots, create a
quadrant gate to isolate the positive and negative cell populations. Click the small
triangle at the bottom-right of the plot to expand the statistical results of the data,
as shown in Figure 74. Right-click any place on the statistical table to select
additional statistical parameters to be calculated for the data, as shown in Figure
75.
Figure 74. Statistical Data
 Loading...