Chapter 5 Analyze the Experiment
View the Amplification Plot
Applied Biosystems 7500/7500 Fast Real-Time PCR System Getting Started Guide for Standard Curve
Experiments
76
Notes
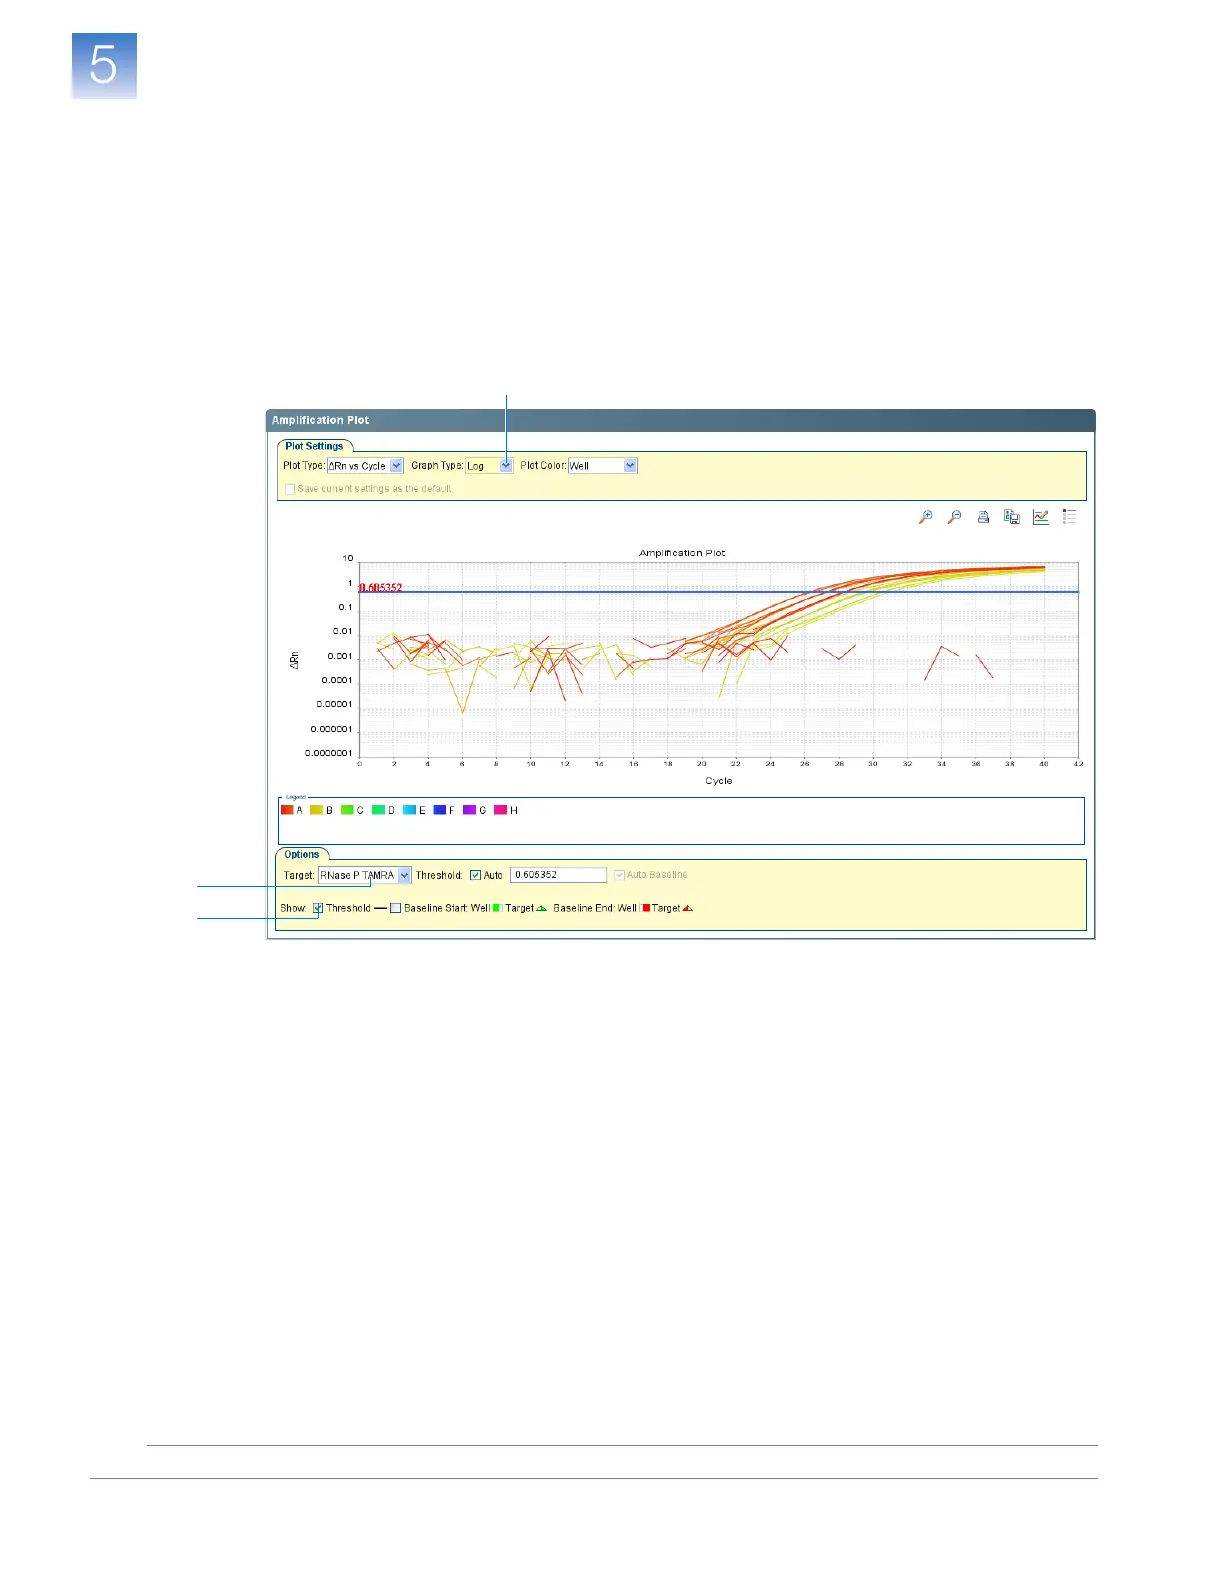
5. View the threshold values:
a. In the Graph Type drop-down list, select Log.
b. In the Target drop-down list, select RNase P TAMRA.
c. Select the Threshold check box to show the threshold.
d. Verify that the threshold is set correctly. In the example experiment, the
threshold is in the exponential phase.
5c
5a
5b