Chapter 5 Analyze the Experiment
View the Amplification Plot
77
Applied Biosystems 7500/7500 Fast Real-Time PCR System Getting Started Guide for Standard Curve
Experiments
Notes
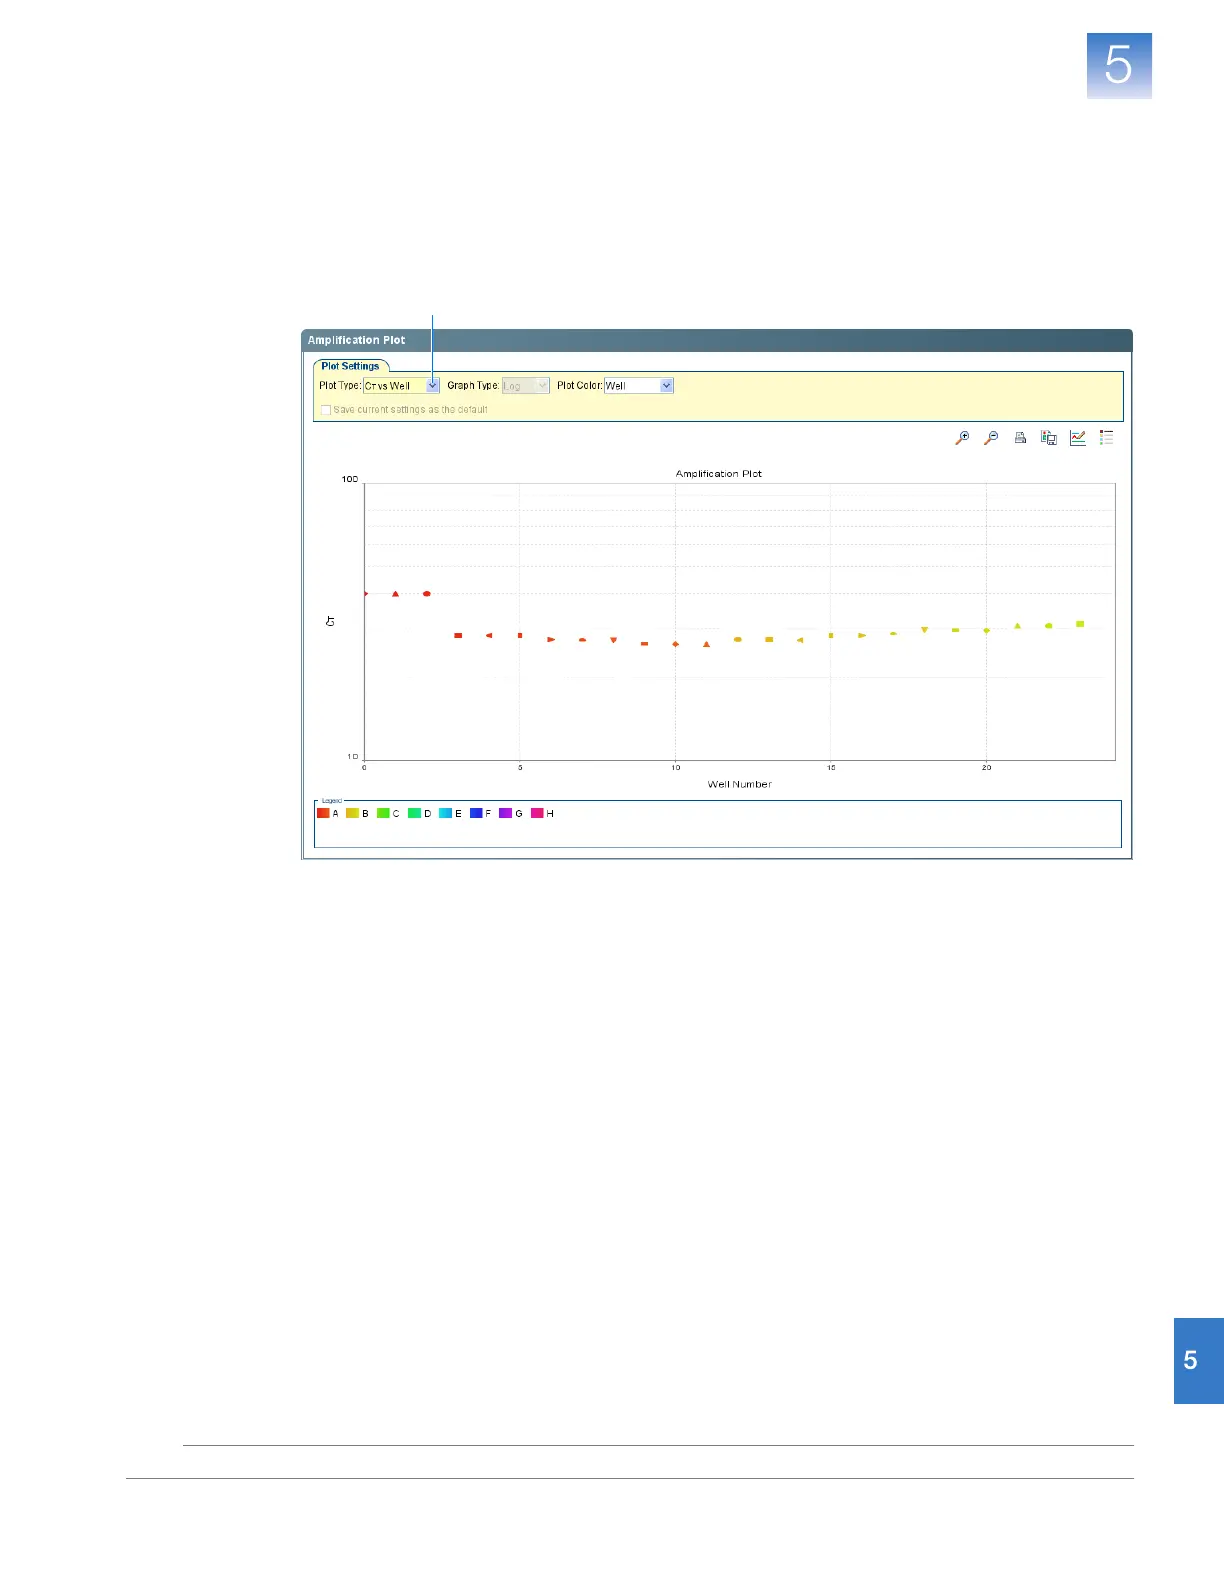
6. Locate any outliers:
a. In the Plot Type drop-down list, select C
T
vs Well.
b. Look for outliers in the amplification plot. In the example experiment, there are
no outliers for RNase P.
6a