Chapter 5 Analyze the Experiment
View the Amplification Plot
Applied Biosystems 7500/7500 Fast Real-Time PCR System Getting Started Guide for Standard Curve
Experiments
78
Notes
Analysis
Guidelines
When you analyze your own standard curve experiment, look for:
•Outliers
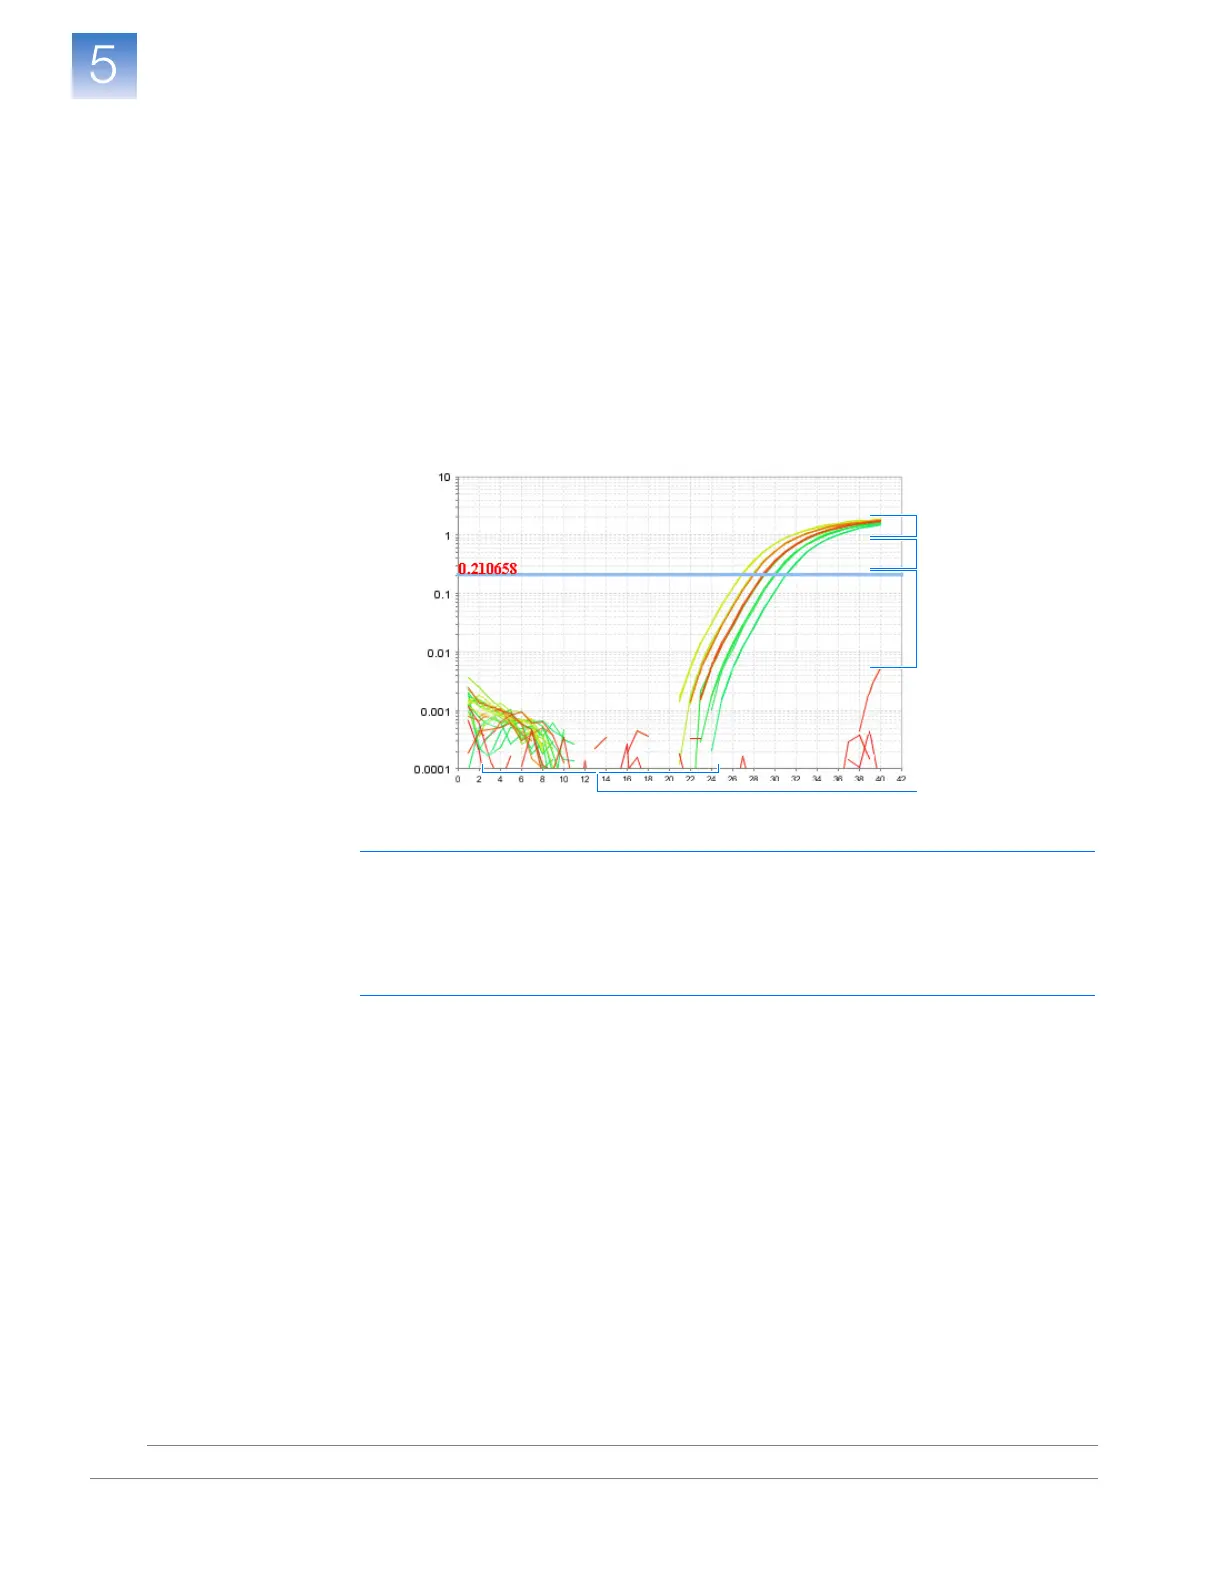
• A typical amplification plot – The 7500 software automatically calculates baseline
and threshold values based on the assumption that the data exhibit a typical
amplification plot. A typical amplification plot has four distinct sections:
a. Plateau phase
b. Linear phase
c. Exponential (geometric phase)
d. Baseline
IMPORTANT! Experimental error (such as contamination or pipetting errors) can
produce atypical amplification curves that can result in incorrect baseline and
threshold value calculations by the 7500 software. Therefore, Applied Biosystems
recommends that you examine the Amplification Plot screen and review the
assigned baseline and threshold values for each well after analysis is complete.
• Correct baseline and threshold values – See the threshold examples on page 79 and
the baseline examples on page 80.
Cycle
∆Rn
a
b
c
d
Threshold



 To Next Page