131
ATtiny26(L)
1477G–AVR–03/05
ATtiny26 Typical
Characteristics
The following charts show typical behavior. These figures are not tested during manu-
facturing. All current consumption measurements are performed with all I/O pins
configured as inputs and with internal pull-ups enabled. A sine wave generator with rail-
to-rail output is used as clock source.
The power consumption in Power-down mode is independent of clock selection.
The current consumption is a function of several factors such as: operating voltage,
operating frequency, loading of I/O pins, switching rate of I/O pins, code executed and
ambient temperature. The dominating factors are operating voltage and frequency.
The current drawn from capacitive loaded pins may be estimated (for one pin) as
C
L
*V
CC
*f where C
L
= load capacitance, V
CC
= operating voltage and f = average switch-
ing frequency of I/O pin.
The parts are characterized at frequencies higher than test limits. Parts are not guaran-
teed to function properly at frequencies higher than the ordering code indicates.
The difference between current consumption in Power-down mode with Watchdog
Timer enabled and Power-down mode with Watchdog Timer disabled represents the dif-
ferential current drawn by the Watchdog Timer.
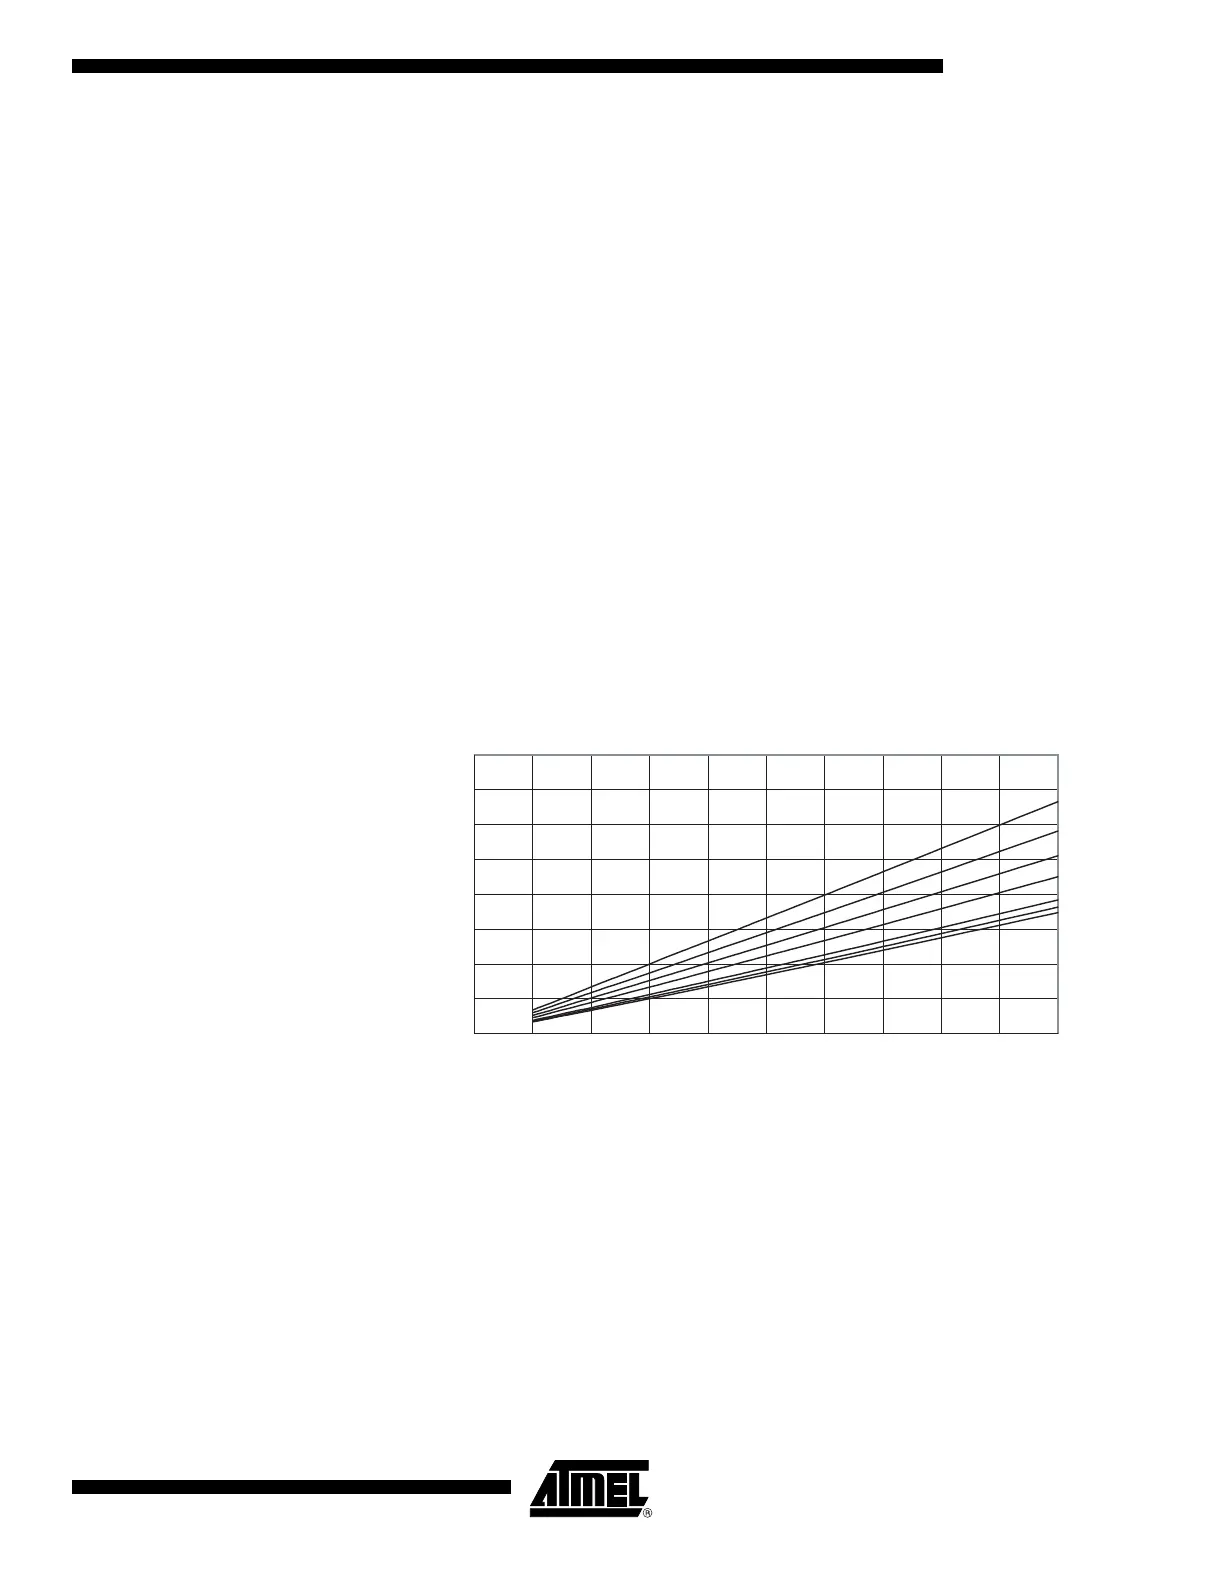
Active Supply Current Figure 71. Active Supply Current vs. Frequency (0.1 - 1.0 MHz)
ACTIVE SUPPLY CURRENT vs. FREQUENCY
0.1 - 1.0 MHz
0
0.2
0.4
0.6
0.8
1
1.2
1.4
1.6
0 0.1 0.2 0.3 0.4 0.5 0.6 0.7 0.8 0.9 1
Frequency (MHz)
I
CC
(mA)
5.5V
4.5V
4.0V
3.3V
2.7V
3.0V
5.0V
 Loading...