9
Measured value graph
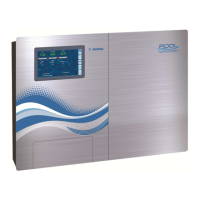
Note: The icon styles available may change and further styles may be
added. The icon style setting in the
all icon styles currently available.
9 Measured value graph
9.1 Overview
PoolManager
®
internally saves all relevant measured values, alarm
statuses, operations for turning on and off, and important parameter
settings throughout the time frame of one entire year.
F
or the time frame of one month, a complete minute
is available. For prior months, the data volume is reduced to one
dataset per 15 minutes.
After one year has passed, the oldest data in the database are
overwritten with current data.
The
measured value graph can be called up at any time as follows:
Menu hotkey
Measuremente graph
Stored data can be graphically displayed on the device display at any
time. Remote access to the measured value graph is also possible
without restriction
(prerequisite: The browser must support HTML 5).
The following display variations can be selected:
•
Display of a measured variable with alarm thresholds and
complete alarm status.
•
Joint display of two measured variables without alarm thresholds
and only wit
h flow status and/or flow alarm.
User Manual PoolManager
®
Note: The icon styles available may change and further styles may be
menu shows you
internally saves all relevant measured values, alarm
statuses, operations for turning on and off, and important parameter
settings throughout the time frame of one entire year.
or the time frame of one month, a complete minute
-by-minute dataset
is available. For prior months, the data volume is reduced to one
After one year has passed, the oldest data in the database are
measured value graph can be called up at any time as follows:
Stored data can be graphically displayed on the device display at any
time. Remote access to the measured value graph is also possible
(prerequisite: The browser must support HTML 5).
The following display variations can be selected:
Display of a measured variable with alarm thresholds and
Joint display of two measured variables without alarm thresholds
h flow status and/or flow alarm.
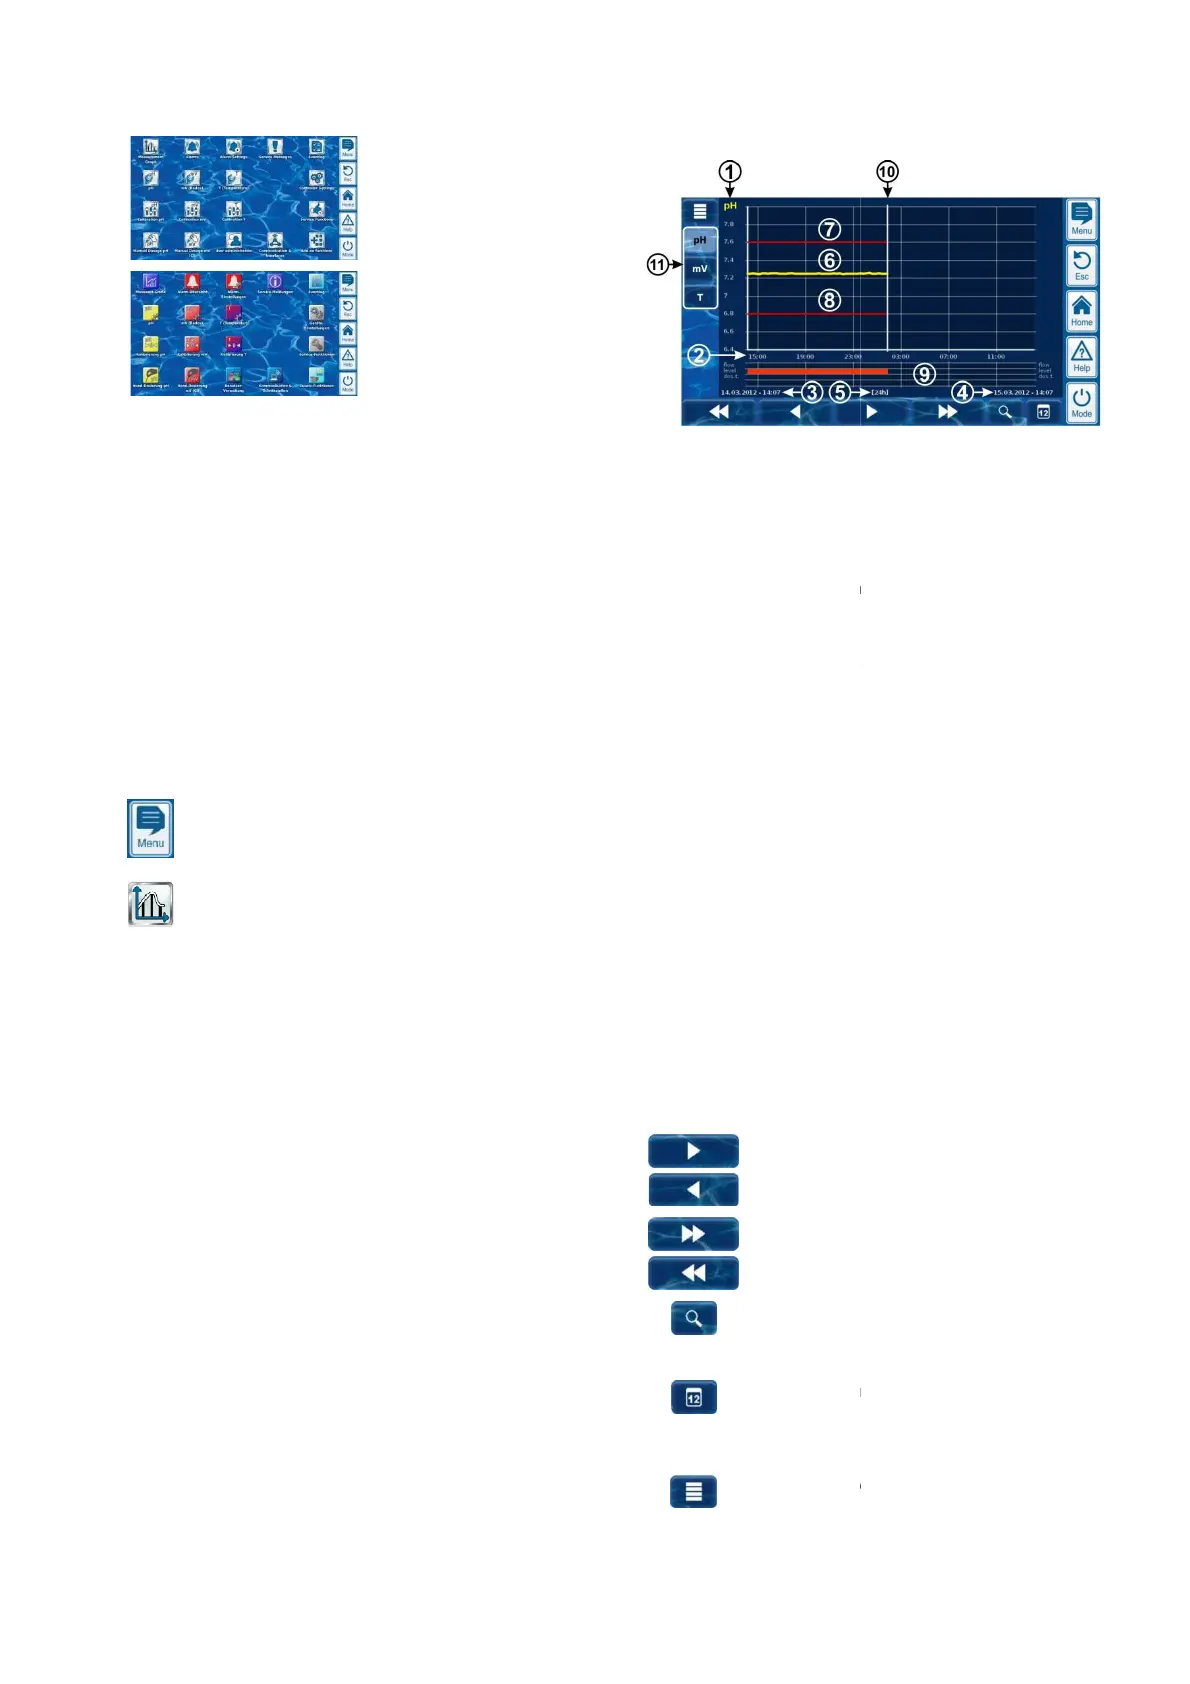
The following figure provides an overview of the
1
Scale for the measured variable shown (e.g. pH)
2
3
Start date and time for the
currently displayed (date
4
End date and time for the
currently displayed (date and time on the right edge)
5
Time range currently displayed
[1h] / [4h] / [12h] / [24h] / [1 week]
6
7
8
9
Alarm status (flow / level / dosage alarm)
An alarm is indicated by a red bar in the respective
time frame.
10
Current point in time (= End of
11
Selection keys for showing one or two measured
variables
Pressing a key activates or deactivates display of the
respective measured variable.
The measured variables currently displayed have a
A maximum of 2 measured variables can be activated
(it may be necessary to deactivate a measured
variab
le first before another can be activated)
Slow scroll forward and/or backward along the time
axis by one half screen width, i.e. for example, by 12
hours if the screen displays 24 hours.
Quick scroll forward and/or backward along the time
axis
by one full screen width, i.e. for example, by 24
hours if the screen displays 24 hours.
Zoom function -
opens a selection menu for the time
1h / 4h / 12h / 24h / 1 week
Go to date -
Opens entry screen for a date.
After enter
ing the date and confirming, the
measurement
graph jumps directly to the date
indicated.
Menu -
Opens the configuration menu for the
measurement
24
The following figure provides an overview of the
measurement graph:
Scale for the measured variable shown (e.g. pH)
Start date and time for the
measurement graph
currently displayed (date
and time on the left edge)
End date and time for the
measurement graph
currently displayed (date and time on the right edge)
Time range currently displayed
[1h] / [4h] / [12h] / [24h] / [1 week]
Alarm status (flow / level / dosage alarm)
An alarm is indicated by a red bar in the respective
Current point in time (= End of
measurement graph)
Selection keys for showing one or two measured
Pressing a key activates or deactivates display of the
respective measured variable.
The measured variables currently displayed have a
A maximum of 2 measured variables can be activated
(it may be necessary to deactivate a measured
le first before another can be activated)
Slow scroll forward and/or backward along the time
axis by one half screen width, i.e. for example, by 12
hours if the screen displays 24 hours.
Quick scroll forward and/or backward along the time
by one full screen width, i.e. for example, by 24
hours if the screen displays 24 hours.
opens a selection menu for the time
1h / 4h / 12h / 24h / 1 week
Opens entry screen for a date.
ing the date and confirming, the
graph jumps directly to the date
Opens the configuration menu for the