13
Automatic dosage O2 (BayroSoft)
User Manual PoolManager
®
39
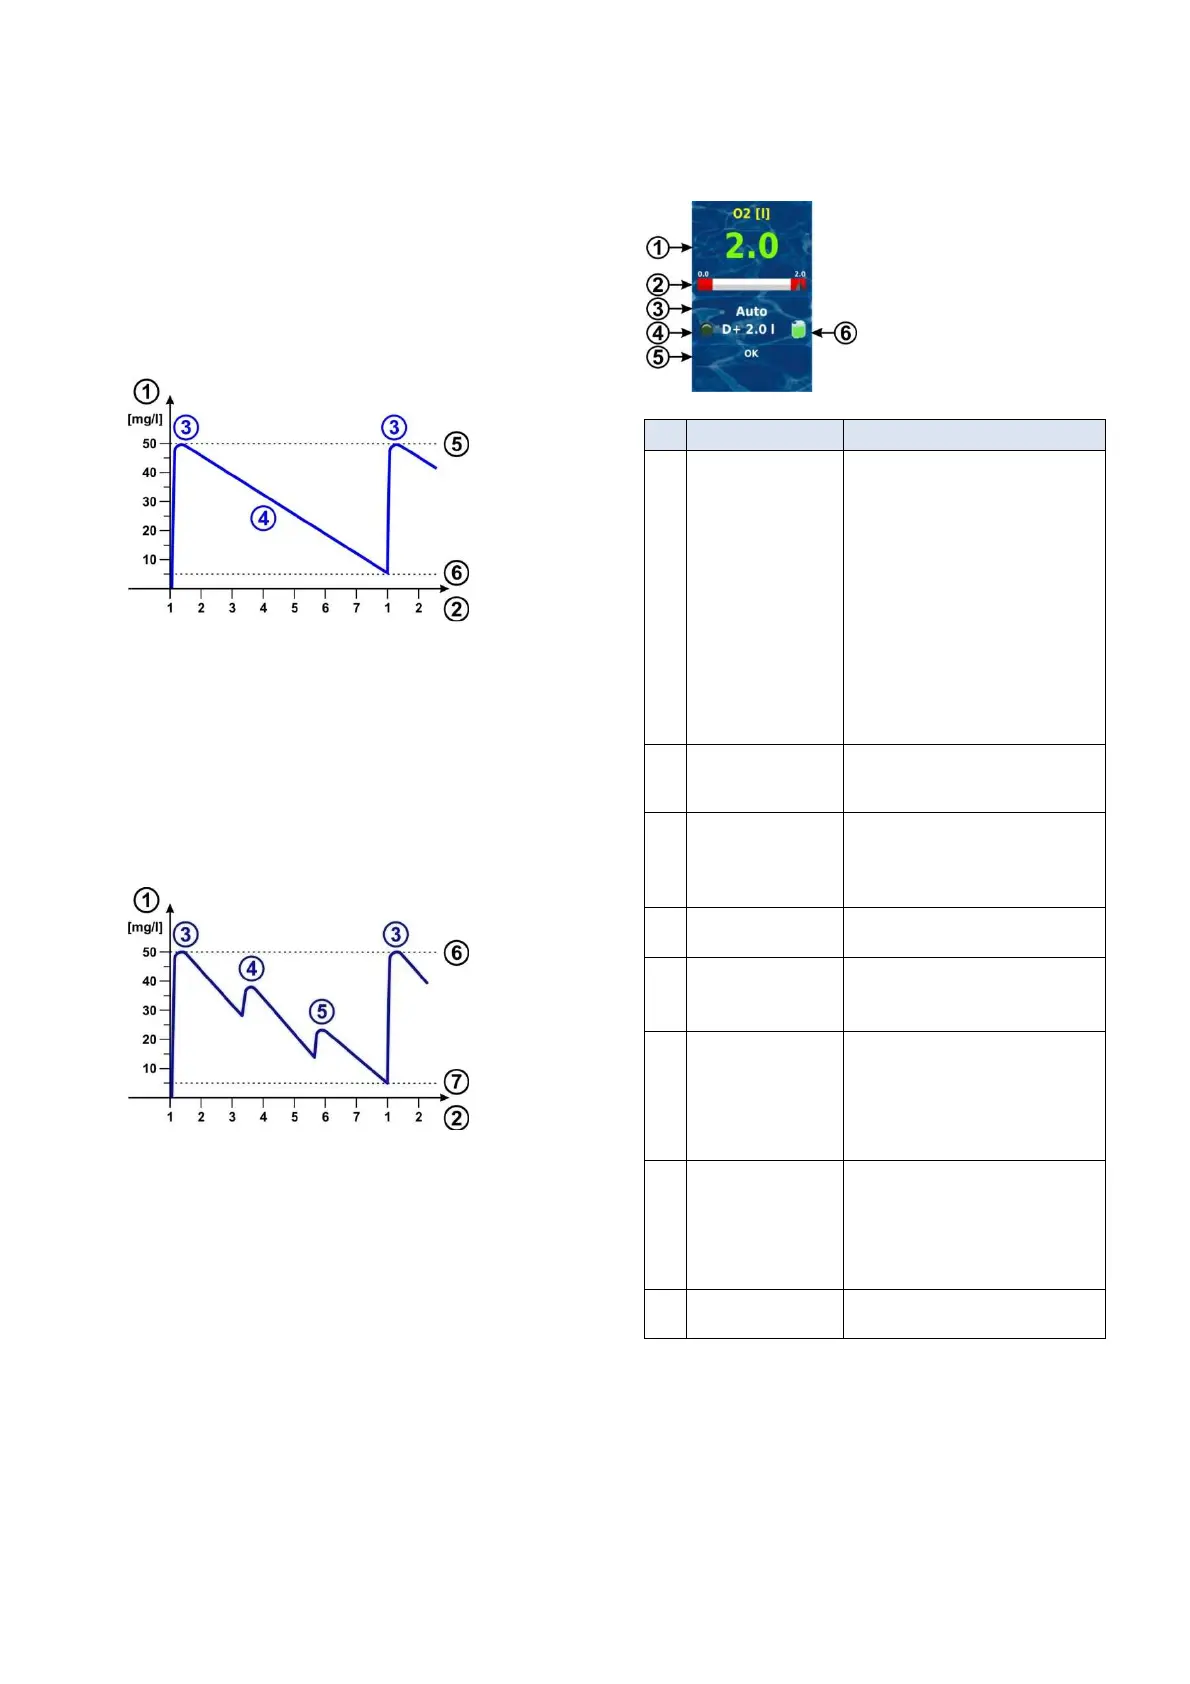
13.1.3 Progression of effective BayroSoft concentration
The following two figures schematically show the progression of the
effective BayroSoft concentration in the water over the course of a
week.
In the first example, the average water temperature is 24°C. Thus, the
two refresh dosages are omitted.
In the second example, the water temperature is 28°C. Therefore the
two refresh dosages provide an interim increase in the effective
BayroSoft concentration in the water.
Automatic dosage at 24°C (without refresh dosages)
1 BayroSoft concentration in the pool in [mg/l]
2 Weekdays (1 = main dosage day)
3 Main dosage
4 Reduced BayroSoft concentration due to product consumption
5 BayroSoft concentration after a main dosage
(ca. 50 mg/l, "shock disinfection")
6 Requisite minimum concentration of BayroSoft (ca. 5 mg/l)
Automatic dosage at 28 °C (without refresh dosages)
1 BayroSoft concentration in the pool in [mg/l]
2 Weekdays (1 = main dosage day)
3 Main dosage
4 1st Refresh dosage after 1/3 week
5 2nd Refresh dosage after 2/3 week
6 BayroSoft concentration after a main dosage
(ca. 50 mg/l, "shock disinfection")
7 Requisite minimum concentration of BayroSoft (ca. 5 mg/l)
13.2 Display in home view
Pos. Content Notes
1
Programmed dose
amount
(Basic dose amount)
During ongoing dosage, the amount
already dosed is displayed, i.e. the display
rises continuously from 0.0 litre to the total
dose amount.
After completing dosage, the display jumps
back to the programmed dose amount.
Colour of measured value display:
green
Normal operation,
everything OK
‘
yellow
Dosage blocked
(missing flow signal
and/or start delay)
rot
Alarm, dosage blocked!
2 Measured value scale The measured value scale graphically
shows the amount already dosed
throughout an ongoing dosage.
3 Current operating state
Auto / off / alarm / flow / start delay
("x min") /
ongoing dosage (display of remaining
time in minutes "x min")
4a LED symbol The LED symbol illuminates while the O2
(BayroSoft) dosage pump is running.
4b
Current dosing
direction
and/or type of dosage
D+ for automatic dosage and M for manual
dosage (M = "manual")
4c Current dose amount
(or programmed
dose amount)
While dosage is running, this shows the
total dose amount of the current dosage
(main dosage, refresh dosage, or manual
dosage).
After completing dosage, the display jumps
back to the programmed dose amount.
5 Alarms All active alarms are shown regarding the
O2 (BayroSoft) module.
Alarms whose cause has already been
remediated disappear from the display,
even if they have not been acknowledged.
If there is no active alarm, "OK" appears.
6 Canister symbol Fill level for the BayroSoft canister (red /
yellow / green)