1 689 989 115 2013-08-30| Robert Bosch GmbH
Technical data | FSA 500 | 33 en
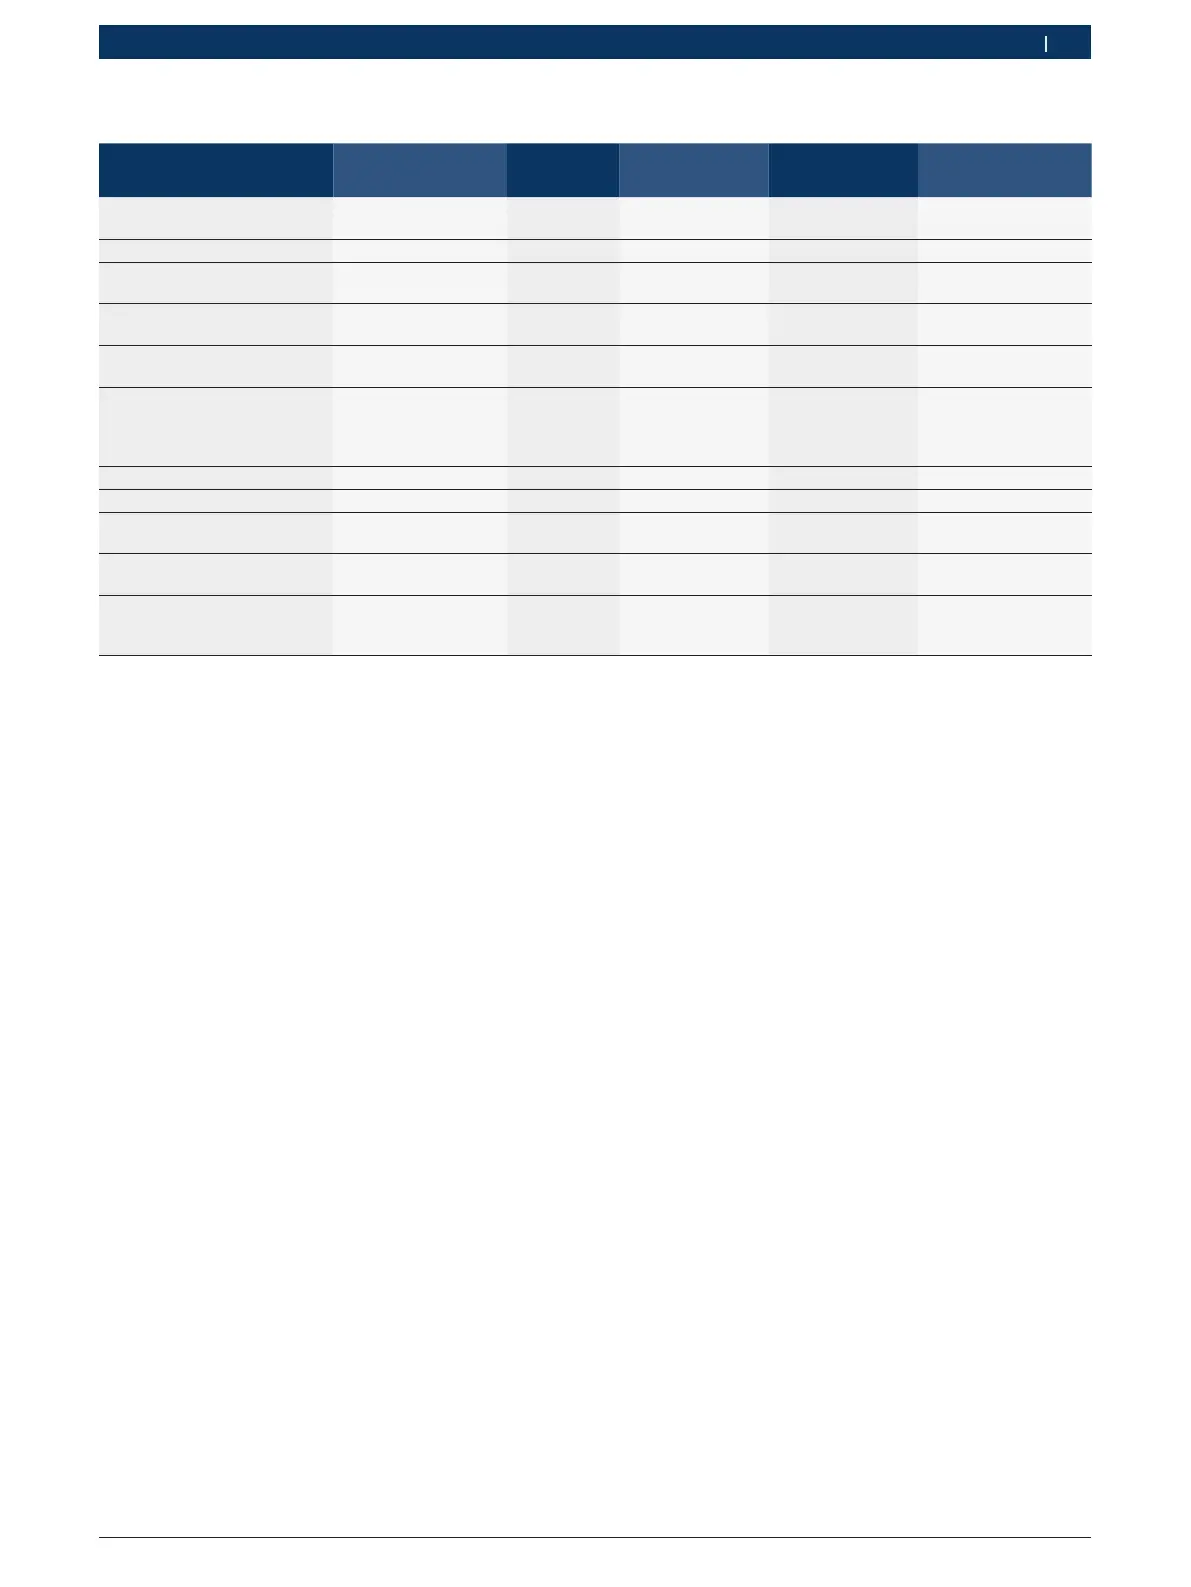
8.9.3 Specification measurement leads
Designation Order number Measuring
category
Max. measuring
voltage
Output sensitivity
sensor lead
Max. output voltage
on measuring lead
Connecting cable B+/B– 1 684 460 286 CAT 0 60 VDC, 30 VAC,
300 VACpeak
– 60 V
Clip-on trigger 1 687 225 018 CAT 0 30 kV ACpeak
2)
5 V
Primary connecting cable
(UNI2)
1 684 461 185 CAT 0 32 VDC, 30 VAC,
320 VACpeak
3)
320 V
Multi measurement lead CH1
Multi measurement lead CH2
1 684 460 288
1 684 460 289
CAT 0 60 VDC, 30 VAC,
42VACpeak
3)
60 V
Measurement lead
with voltage divider
1 687 224 301 CAT 0 60 VDC, 30 VAC,
300 VACpeak
25 V/V 20 V
Accessory set with:
Test prods
Pick-off clips
Adapter connectors
1 687 016 118
1 684 485 434/ … 435
1 684 480 403/ … 404
1 684 480 125
CAT 3
CAT 2
CAT 2
1000 V AC/DC
1000 V AC/DC
600 V AC/DC
–
–
–
30 V
300 V
30 V
Current probe 1000 A 1 687 225 019 CAT 0 300 V AC/DC 100 mV/A 5 V
Current probe 30 A 1 687 225 020 CAT 0 300 V AC/DC 4 mV/A 5 V
Accessory set with test
prods, test clips
1 684 485 362 CAT 0 30 V DC/ACpeak – 60 V
Secondary measuring trans-
ducer
1 687 225 017 CAT 0 30 kV ACpeak 20 mV/kV
1)
1 V
Temperature sensor 1 687 230 068 CAT 0 5 V Resistance:
1005 Ω at 25 °C
1530 Ω at 90 °C
5 V
1)
Connection at secondary input sensor
2)
1.6 Vpeak ±30 % at 100 mA current change within 200 ns with connection at input clip-on sensor (L/C approx. 136 µH/5 nF)
3)
The following applies to voltages >60 V: U[V] x t[ms] ≤ 3200 V*μs, e.g. a voltage of 200 V is not to be applied for longer than 16 μs. The maximum
voltage decreases at frequencies >1 MHz with 20 dB/decade, e.g. sinusoidal 1 MHz max. peak = 200 V / sinusoidal 10 MHz max. peak = 20 V
8.9.4 Oscilloscope
R Measurement system with 8 automatic measurement
functions
$ Mean value
$ Rms value
$ Min
$ Max
$ Peak-to-peak
$ Pulse
$ Duty cycle
$ Frequency
R Selectable signal range
$ Full curve or between cursors
R Zoom
$ Selectable curve section for horizontal and verti-
cal enlargement
R Adjustable cursors with display for
$ x1, x2
$ delta x
$ y1 and y2 (channel 1)
$ y1 and y2 (channel 2)
R Reference curves
$ Storage, loading, commenting, pre-setting of
scope set-up for live curves
R Storage functions
$ Scrolling forwards and backwards
$ Search functions e.g. MinMax, duty cycle
R Trigger system
$ Free run (non-triggered run for ≥ 1 s)
$ Auto (curve output even without trigger)
$ Auto level (as Auto, mid-signal trigger threshold)
$ Normal (manual trigger threshold, curve output
only with trigger event)
$ Single sequence
R Trigger edge
$ Edge (pos. / neg. on signal)
R Trigger sources
$ Engine (trigger on cylinder 1 ... 12 with clip-on
trigger, term. 1, KV sensor)
$ External trigger via term. 1_1 wire or clip-on trig-
ger
$ Multi measurement lead CH1 / CH2
R Pre-trigger component
$ 0 to 100 %, adjustable with mouse
R Recording modes
$ MaxMin (Peak/Glitchdetect)
$ Interference pulses
$ Sample (equidistant sampling)
R Storage and curve output modes
$ Roll mode (single point output) with complete
storage of signals for X-sweeps ≥ 1 s
$ Legend mode (curve output) with complete stor-
age of signals for X-sweeps ≥ 1 ms
$ Normal mode with storage of last 50 curves
displayed for X-sweeps < 1 ms
 Loading...
