28
ENG
+040000021 - rel. 2.0 - 20.02.2009
9. INSTALLATION
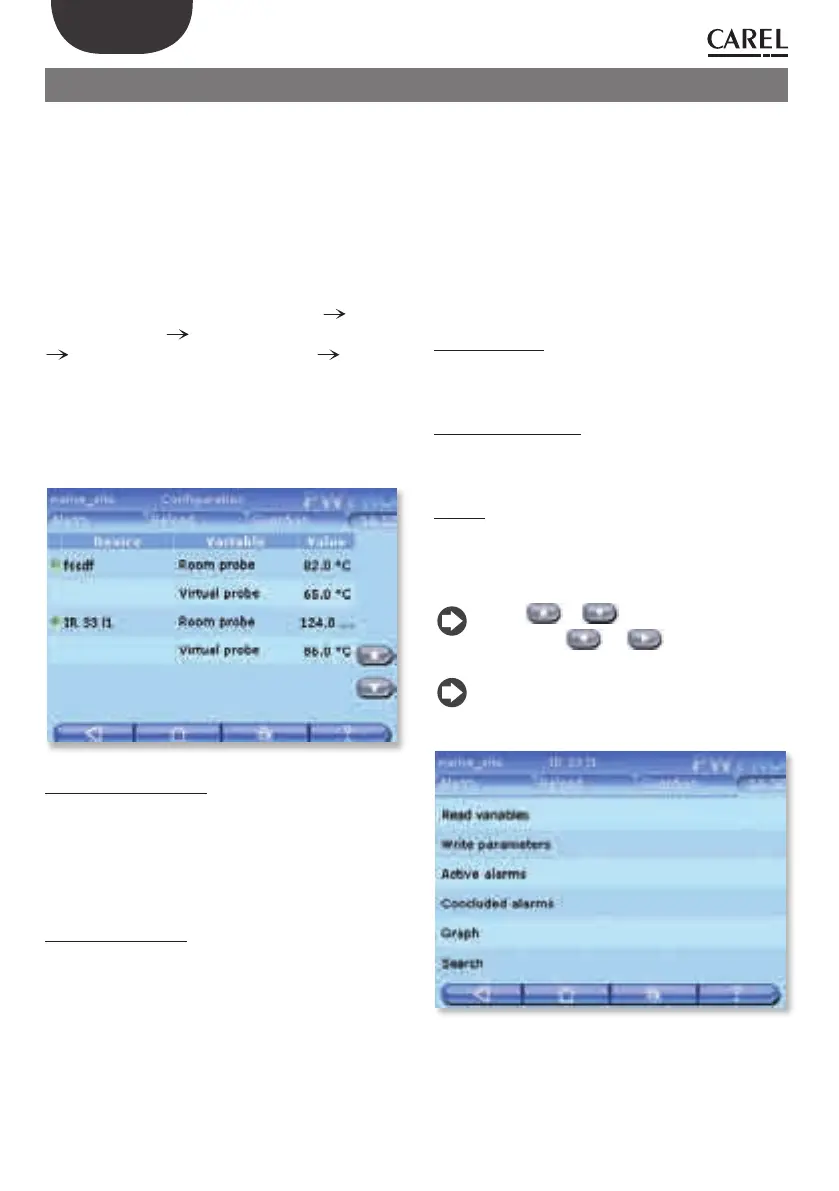
When entering this menu a list is displayed showing
all the devices available in the installation and their
status: the graphic LEDs next to the names of the
devices have the following meanings:
green - everything is working correctly.•
red - the device has an alarm.•
blue - device disabled.•
grey - device off -line.•
In addition, the main variables previously selected to
be displayed (from the CONFIGURATION
MODEL
MANAGEMENT CONFIGURATION MODELS
LOG/GRAPH/HACCP/MAIN VIEW DEVICE
DETAIL menu) are shown, or alternatively the default
variables and the corresponding values.
Accessing the detail of each device, the alarms can
be acknowledged (both concluded and active) and
the graph of the trend of the variables displayed.
Read-only variables
Favourites
Displays the variables set as favourites.
All variables
Displays all the variables.
Write parameters
Favourites
Displays the parameters set as favourites.
All parameters
Displays all the parameters.
Group 1 – Alarm con guration
Displays the list of alarm confi guration parameters.
Group 2 – Control
Displays the list of control parameters.
Group 3 - Control
Displays the list of system clock parameters.
Other groups
Group 4 – Device con guration
Displays the list of parameters relating to the
confi guration of the device in question.
Group 5 - Functions
Displays the list of parameters relating to the
functions.
Active alarms
Goes to the list of active alarms (see Chapter 11
ALARMS/EVENTS).
Concluded alarms
Goes to the list of concluded alarms (see Chapter 11
ALARMS/EVENTS).
Graph
Graph of the variables. The horizontal axis shows the
time scale, while the vertical axis shows the values of
the variable. (The colours have been set previously
by the user in the CONFIGURATION menu).
use the & buttons to scroll the time
axis and the
& buttons to move
from one device to another.
PlantWatchPRO can plot up to fi ve values at the
same time.
 Loading...