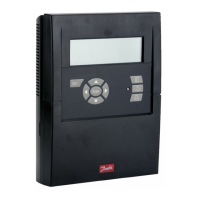
The display
This section will explain all the different functions in the different
display screens.
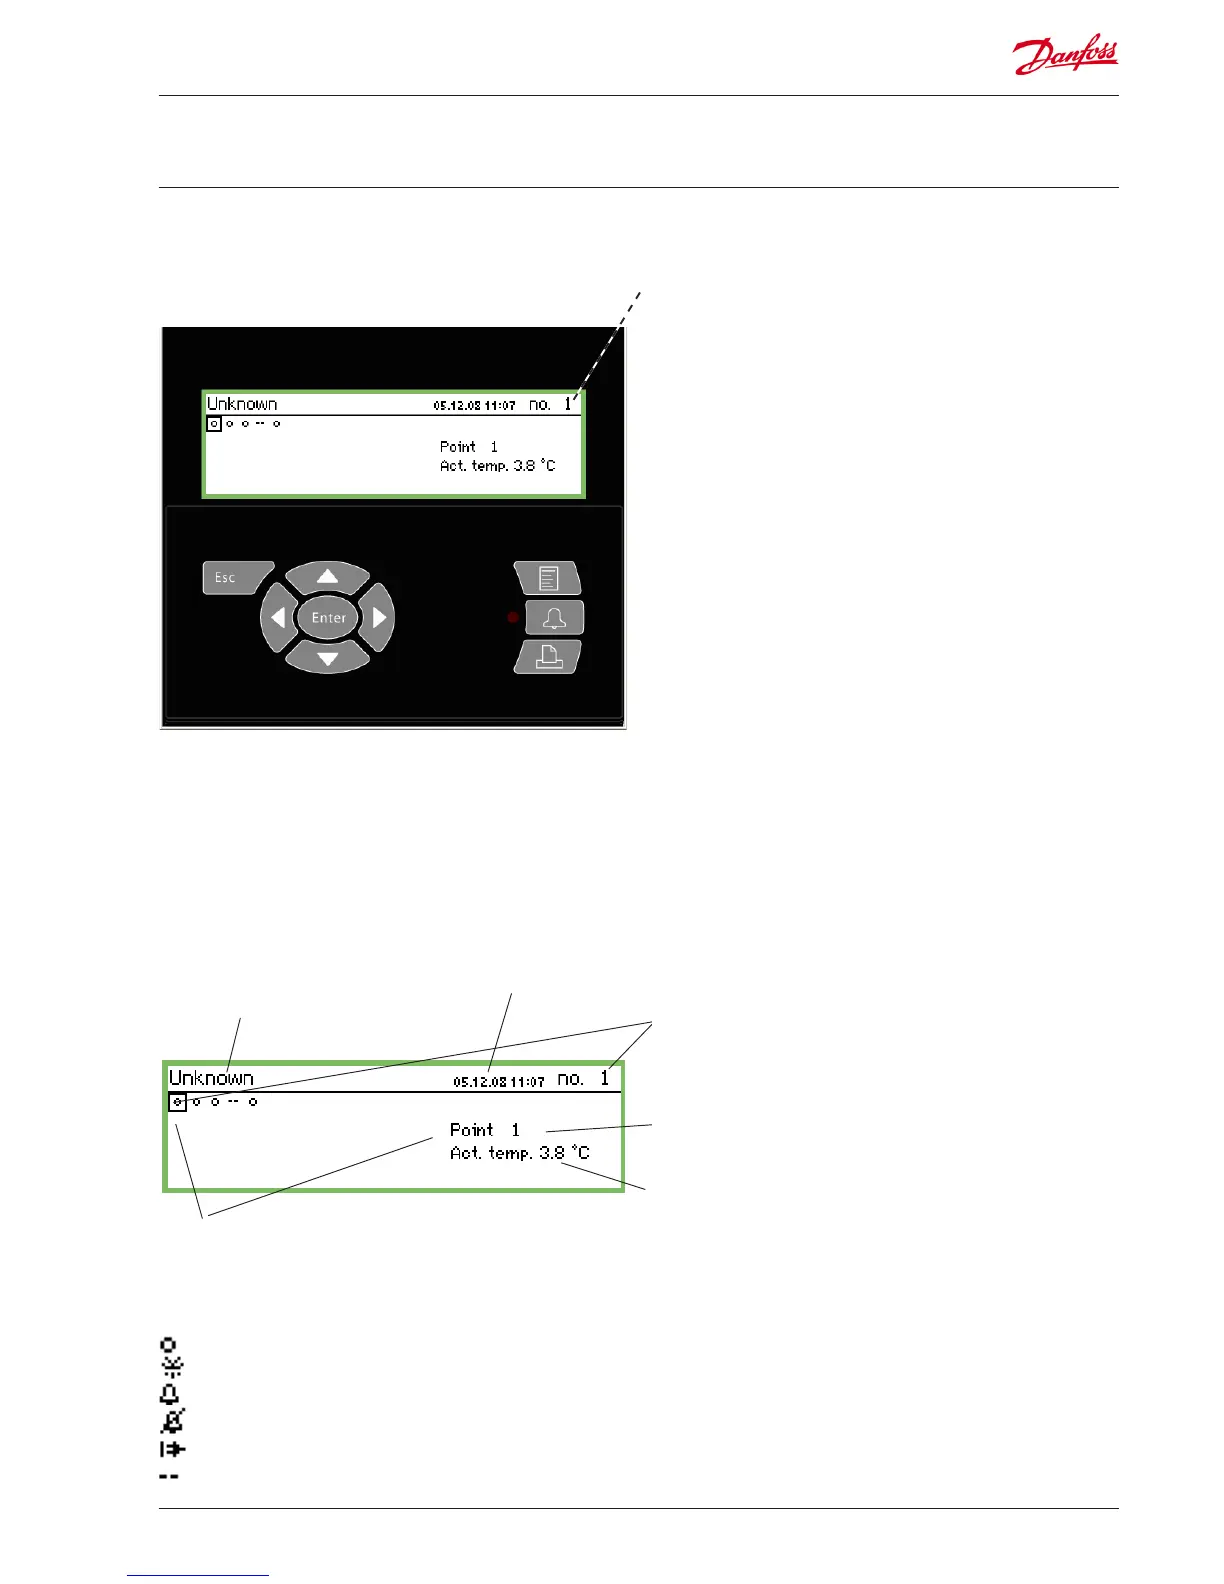
Name
The name of the plant will be entered here.
Date and time
Point number
Here it is no. 1 of the 5 defined points.
This text will be replaced with a text that tells you more about the
point, e.g. "Fruit and vegetables".
Reading
Symbol for each point
When a point is marked with a square, the text and reading for this
point will be shown at the right of the display.
A symbol for the point is shown inside the square.
The symbol could be one of the following:
Circle = Point
Drops = Defrost
Alarm
The alarm has been suppressed (via the "More details" screen)
Connector = No link to controller
Dashes = Configuration error. See page 25 for information.
In the overview display you can use the buttons to get to the
different points, or the monitoring unit can be set up to "scroll"
through the points. The view is reset once the last point has been
shown.
When an arrow is shown in this position, you can move to the next
or previous point (or display) by pressing the "right arrow" or "left
arrow".
This is the overview display that shows all the defined readings.
Here each point is represented by a symbol.
Point 1 is at the top left. 2 comes next and so on. A total of 65
points, and thus 65 readings, can be shown.
A reading can be a :
• Temperature reading
• Voltage signal or current signal
• On/o signal from e.g. a door switch
• Pulse signal from an output reading
• Signal indicating that a defrost cycle is in progress
• Signal from a gas detector
• Signal from a refrigeration controller. In this case the reading
could be a temperature etc.
If you want to see the reading for point 3 for example, you need
to press the "right arrow" or "left arrow" a number of times until
point 3 is highlighted. Then you need to press "Enter" in order to
see the next display.
The overview display
The readout always returns to the overview display if it is inactive
for two minutes.
Scanning of all points
This function can be chosen as an option. The point's value is
shown here for about 3 seconds. Then it moves on to the next
point. When all the points have been scanned, the process starts
again from the beginning.
The functions' mode of operation
 Loading...