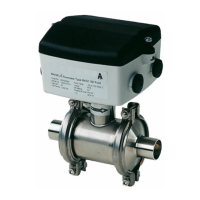
When you want to see a graph of the collected temperatures
1. Select the point for which you want to see a graph. Point 4 has
been chosen here.
2. Press "Enter" when the line "Show graph" is highlighted.
The scaling of the vertical axis is determined by all the values
and by the two alarm limits. Here these are 5 and 10°C
(If these values are set too far outside the range, the graph will
be compressed.)
3. Press "Enter" again and a vertical line will appear along the time
axis.
You can move this vertical line by pressing the "left arrow" or
"right arrow".
You can follow the position of the line in the top line. This is
where the date and time is given. On the left of the date you can
see the corresponding temperature value.
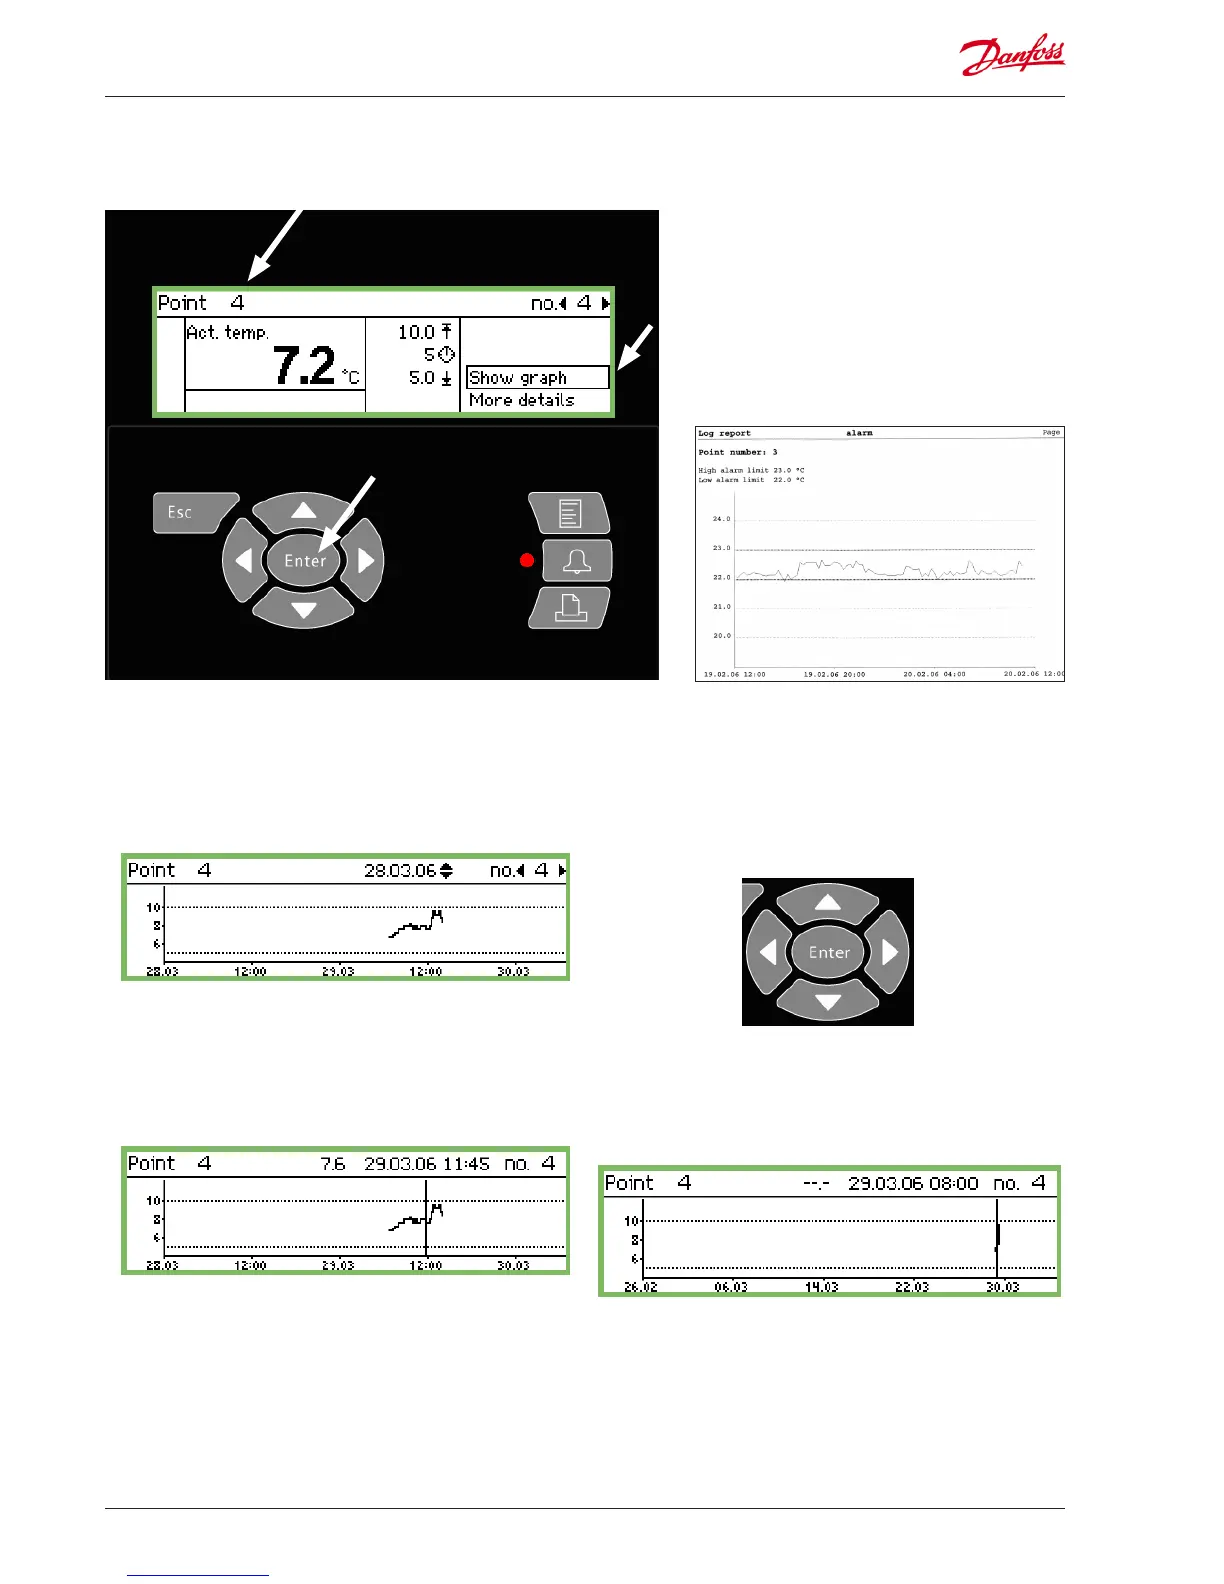
You can move the line "back in time" and see more tempera-
tures that were collected earlier. When you go back far enough,
e.g. a year, there will not be any more values. These values have
been deleted from the memory to make room for newer values.
Zoom out
The screen will begin with a time period of 2 days. If you want to
see a longer period, you must press the "up arrow".
You can press this several times. By doing this you can change the
period to 4, 8, 16 or 32 days.
You can zoom in again by pressing the "down arrow".
Example
 Loading...