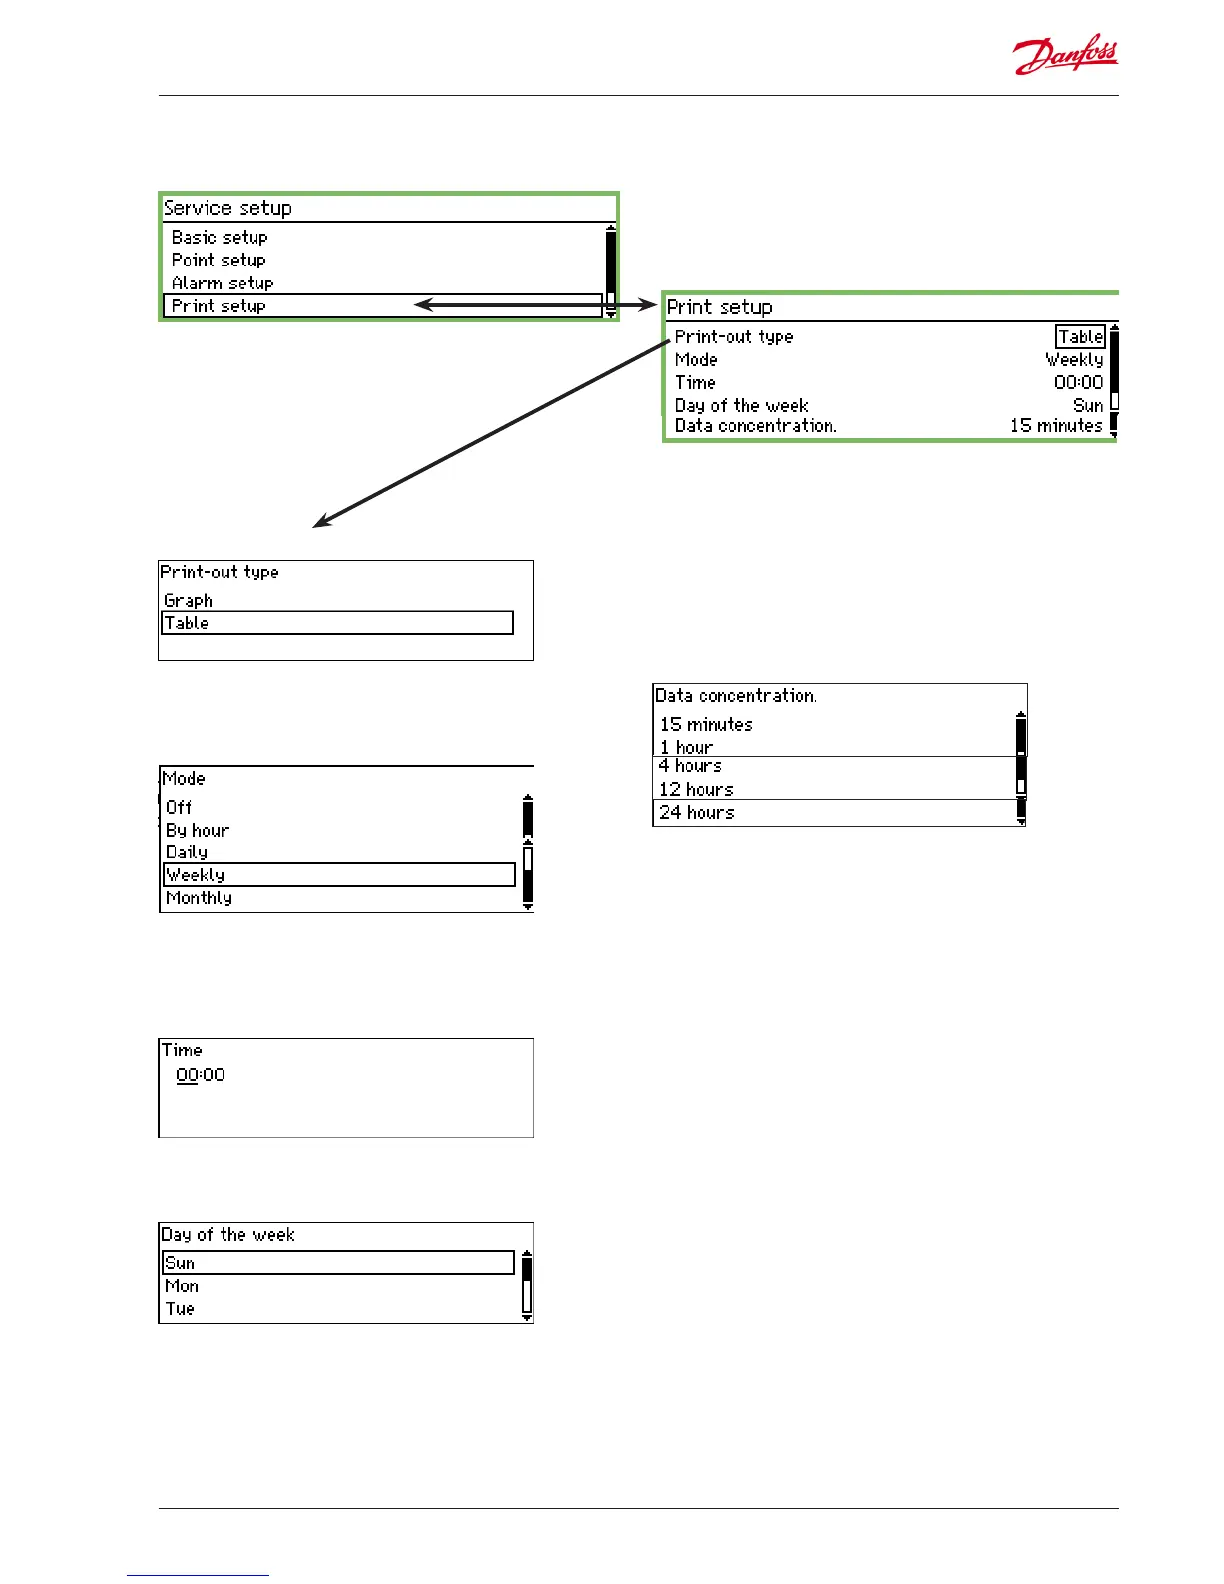
Print setup
Graph or table
Select how the readings will be presented
Choose between Graph or Table. In the following screenshot you
can see the settings that appear if Table has been chosen.
The frequency of the print-outs
Select one of the possible periods. In the following screenshot you
can see the settings that appear if weekly has been chosen.
The time of day of the print-outs
Set the time.
The day of the week of the print-outs
Set the day.
Data concentration
With this function the measured values recorded can be present-
ed in concentrated form. A series of readings is averaged here, so
only the points' mean temperatures are shown.
Example
A reading is taken every 15 mins. The setting is set to 1 hour.
The values shown are the average for the 4 readings.
Set the length of time over which the averaging should take place.
 Loading...

