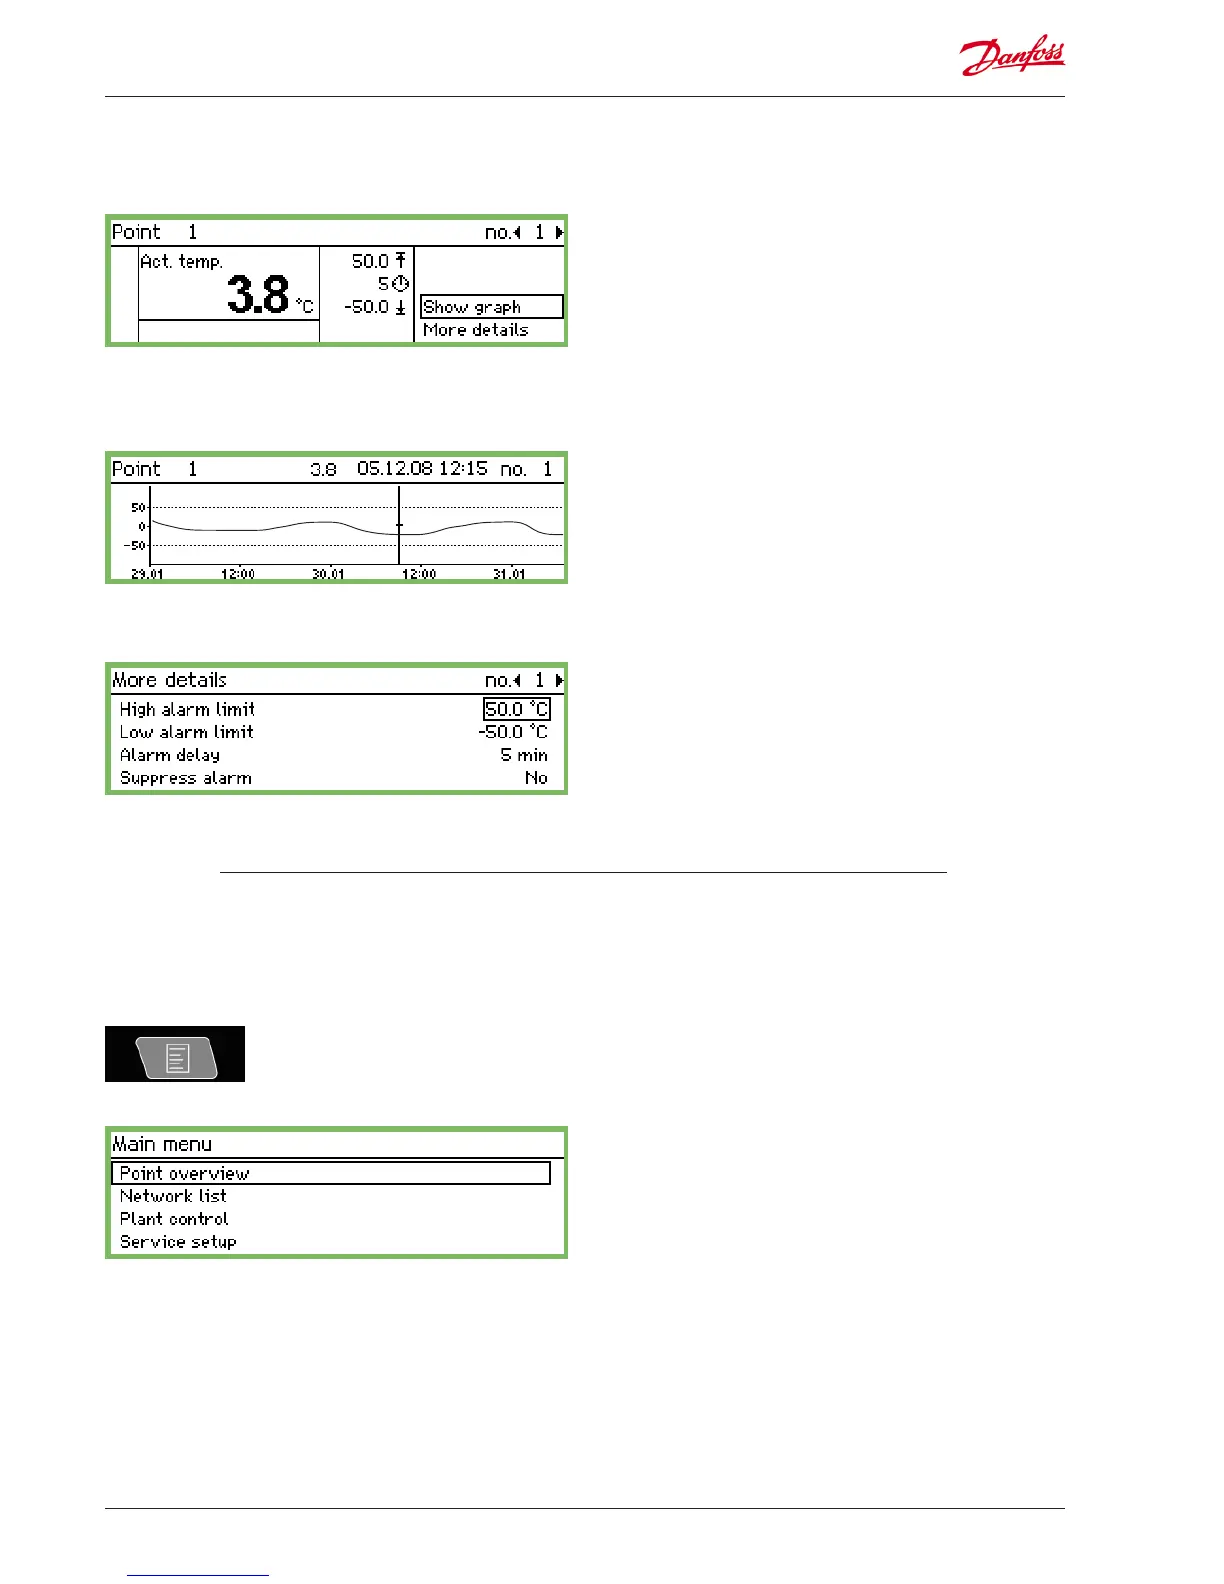
Main menu
The main menu comes up if you press the top right-hand button
on the front panel.
You can access the following four functions from this menu:
Display screens for daily use
Point overview
From here you can go back to the overview display. Please see the
previous page.
(The monitoring unit will automatically return to the overview
display if the buttons are not activated for 2 minutes.)
Network list
The units that are connected via data communication are shown
here.
The readout is only available during setup and service (e.g. in an
alarm situation in which no signal is received from a controller).
Plant control
Here you will find the functions that are used in daily operation,
i.e.
• Defrost and lighting schedules
• Defrost setups
• P0-optimization
This screen is described overleaf.
Service setup
This is where the basic setups for the individual points and func-
tions are carried out.
This screen is described from page 20 onwards.
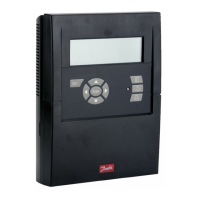
Name and point number
• Symbol illustrating the operating situation of the point
• Temperature values
• Value for the high temperature alarm
• The delay time for the alarm
• Value for the low temperature alarm
• Access to the graph screen etc.
Temperature sequence for the point
If you want to examine the values from the graph more closely,
press "Enter". A vertical line will then be shown on the graph. This
line indicates the time of the graph.
The temperature value for this time is shown on the top line.
The vertical line can be moved using the arrow keys.
If you want to zoom in or out on a time, use the up/down arrow
keys. These are indicated on the top line with an up arrow and
down arrow.
The values in the "More details" screen can be changed from the
monitoring unit. The new setting will be sent to the controller.
The values in "More details" are written to the controller if they are
changed.
• Point detail display, showing the point’s actual values
• Graph display, showing the point’s previous readings
 Loading...