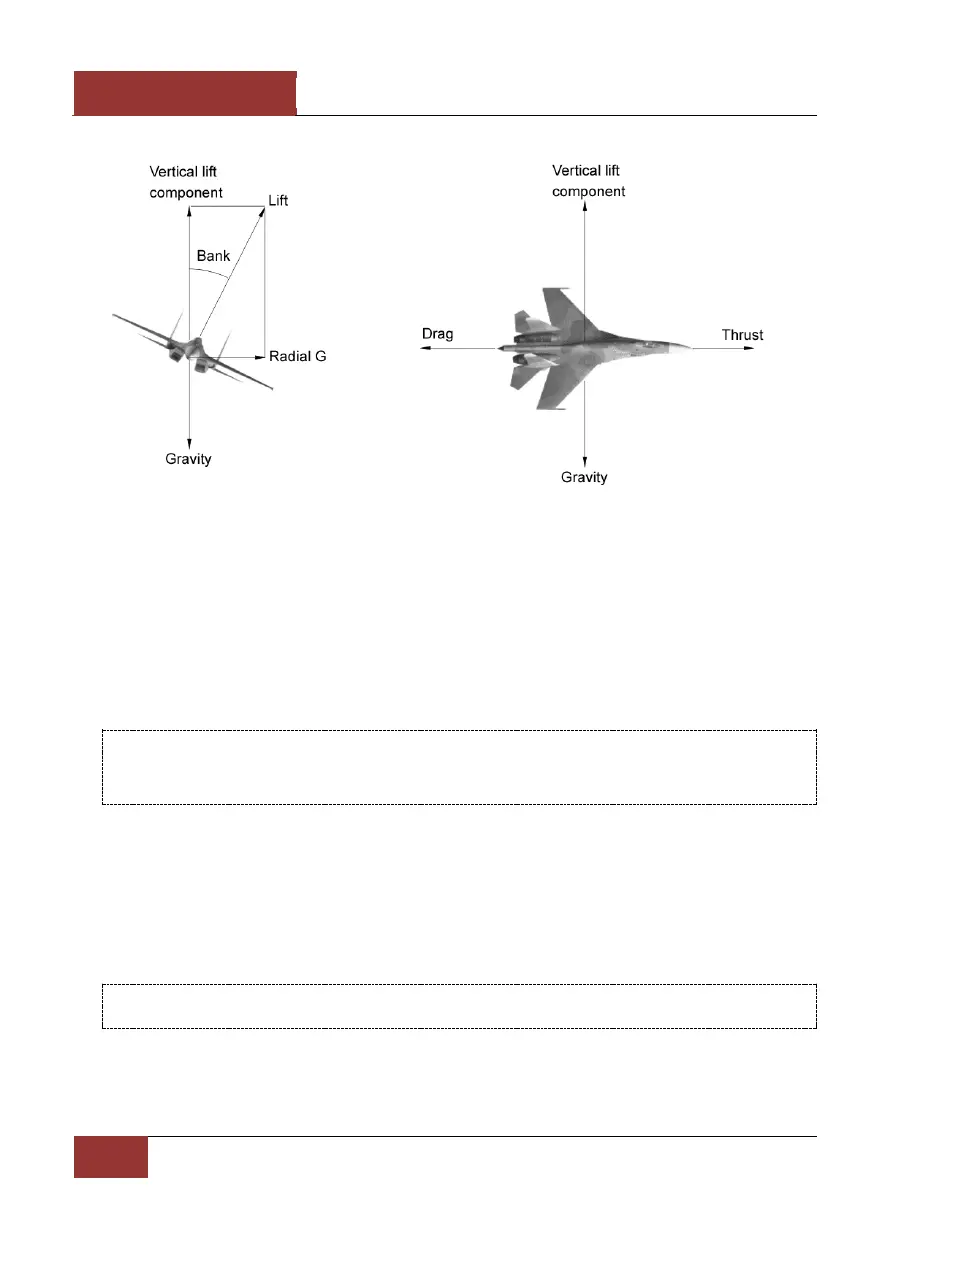
Figure 84: Forces acting at the aircraft maneuver
Turn Rate
When G-load increases: turn rate increases and radius of turn decreases. There is an optimal
balance at which maximum possible turn rate is achieved with the smallest possible turn radius.
THERE IS AN OPTIMAL BALANCE AT WHICH MAXIMUM POSSIBLE TURN RATE IS ACHIEVED WITH THE SMALLEST
POSSIBLE TURN RADIUS.
IN A DOGFIGHT, YOU MUST TO STAY CLOSE TO THIS AIRSPEED
The diagram below illustrates turn rate vs KIAS (knots indicated airspeed) performance chart of a
modern fighter at afterburner thrust. Airspeed is displayed along the X axis and degrees per second
is displayed along the Y axis. The "dog house" looking plot is the aircraft’s turn performance along
this scale. The other lines represent G-loads and radius of turn. Such a diagram is often called a
"dog house" plot or an Energy and Maneuvering (EM) diagram. Though the turn rate at 950 km/h
has a maximum turn rate (18.2 degrees per second), the speed to achieve a smaller turn radius is
around 850-900 km/h. For other aircraft, this speed will vary. For typical fighters, corner speeds are
in 600-1000 km/h range.
YOUR AIRSPEED AND ALTITUDE ARE CRITICAL IN DETERMINING THE TURN PERFORMANCE OF YOUR AIRCRAFT.
LEARN YOUR CORNER SPEEDS AND THOSE OF YOUR ENEMY
For example: performing a sustained turn at 900 km/h, the pilot, if necessary, can pull maximum G to
increase turn rate to 20-degrees per second for a short time period. This simultaneously decreases
turn radius. Doing this, the aircraft will slow down due the high-G excursion. By then entering a