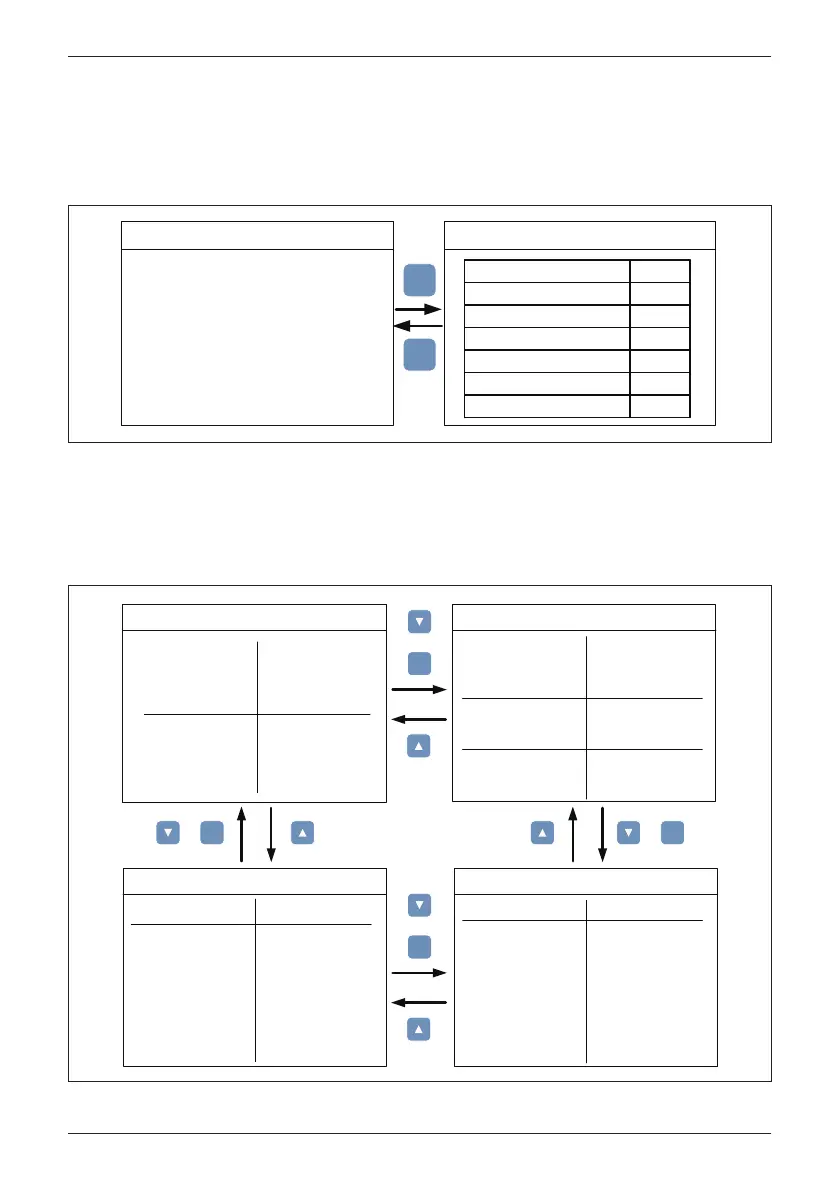
When entering this page, the display will show all the events (error or fault) and
it can show 30 records at most with the latest one on the top. When pressing
ENT, user can view all the statistical data.
5.3.4 Event Log
Figure 5-6 : Event Log Flow Chart
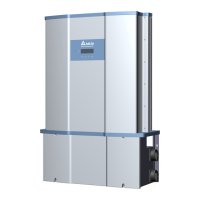
Have 4 pages; record the maximum and/or minimum values of history, including
voltage, current, power and temperature.
5.3.5 Operation Data
Figure 5-7 : Operation Data Flow Chart
Event Log
21. Jun 2010 13:50
1. 15/02/2010 17:02
2. 02/12/2009 09:13
3. 23/11/2009 15:28
4. 03/10/2009 06:02
5. 27/05/2009 05:52
6. 18/02/2009 16:46
AC Freq High
No Grid
HW Fan
Insulation
Insulation
HW DC Injection
Summary
21. Jun 2010 13:50
HW DC Injection
Temperature
HW NTC1 Fail
HW NTC2 Fail
HW NTC3 Fail
HW NTC4 Fail
Event Count
2
1
0
0
0
0
Event Summary – 1/8
1
0
EXIT
ENT
or
Operation Data – 4/4
21. Jun 2010 13:50
Temperature Max. Min.
Inside
Heatsink - R
Heatsink - S
Heatsink - T
(℃)
(℃)
(℃)
(℃)
59
75
74
73
15
15
15
15
Heatsink - U
Heatsink - V
Heatsink - W
(℃)
(℃)
(℃)
75
74
73
15
15
15
Operation Data – 1/4
21. Jun 2010 13:50
Input1
Voltage
Current
Power
Voltage
Current
Power
Input2
Maximum
(Vdc)
(A)
(kW)
(Vdc)
(A)
(kW)
811
853
506.3
810
886
528.3
Operation Data – 2/4
21. Jun 2010 13:50
L1
Voltage
Current
Power
Voltage
Current
Power
Voltage
Current
Power
L2
L3
Maximum
(Vac)
(A)
(kW)
(Vac)
(A)
(kW)
(Vac)
(A)
(kW)
366
1640
345
365
1631
342
360
1645
338
Operation Data – 3/4
21. Jun 2010 13:50
Output
Voltage
Current
Power
Frequency
(Vac)
(A)
(kW)
(Hz)
Maximum
366
1645
1016
50.10
or
ENT
or
ENT
ENT
or
ENT
51
Turn on PV Inverter