75
Click Exit to close the window.
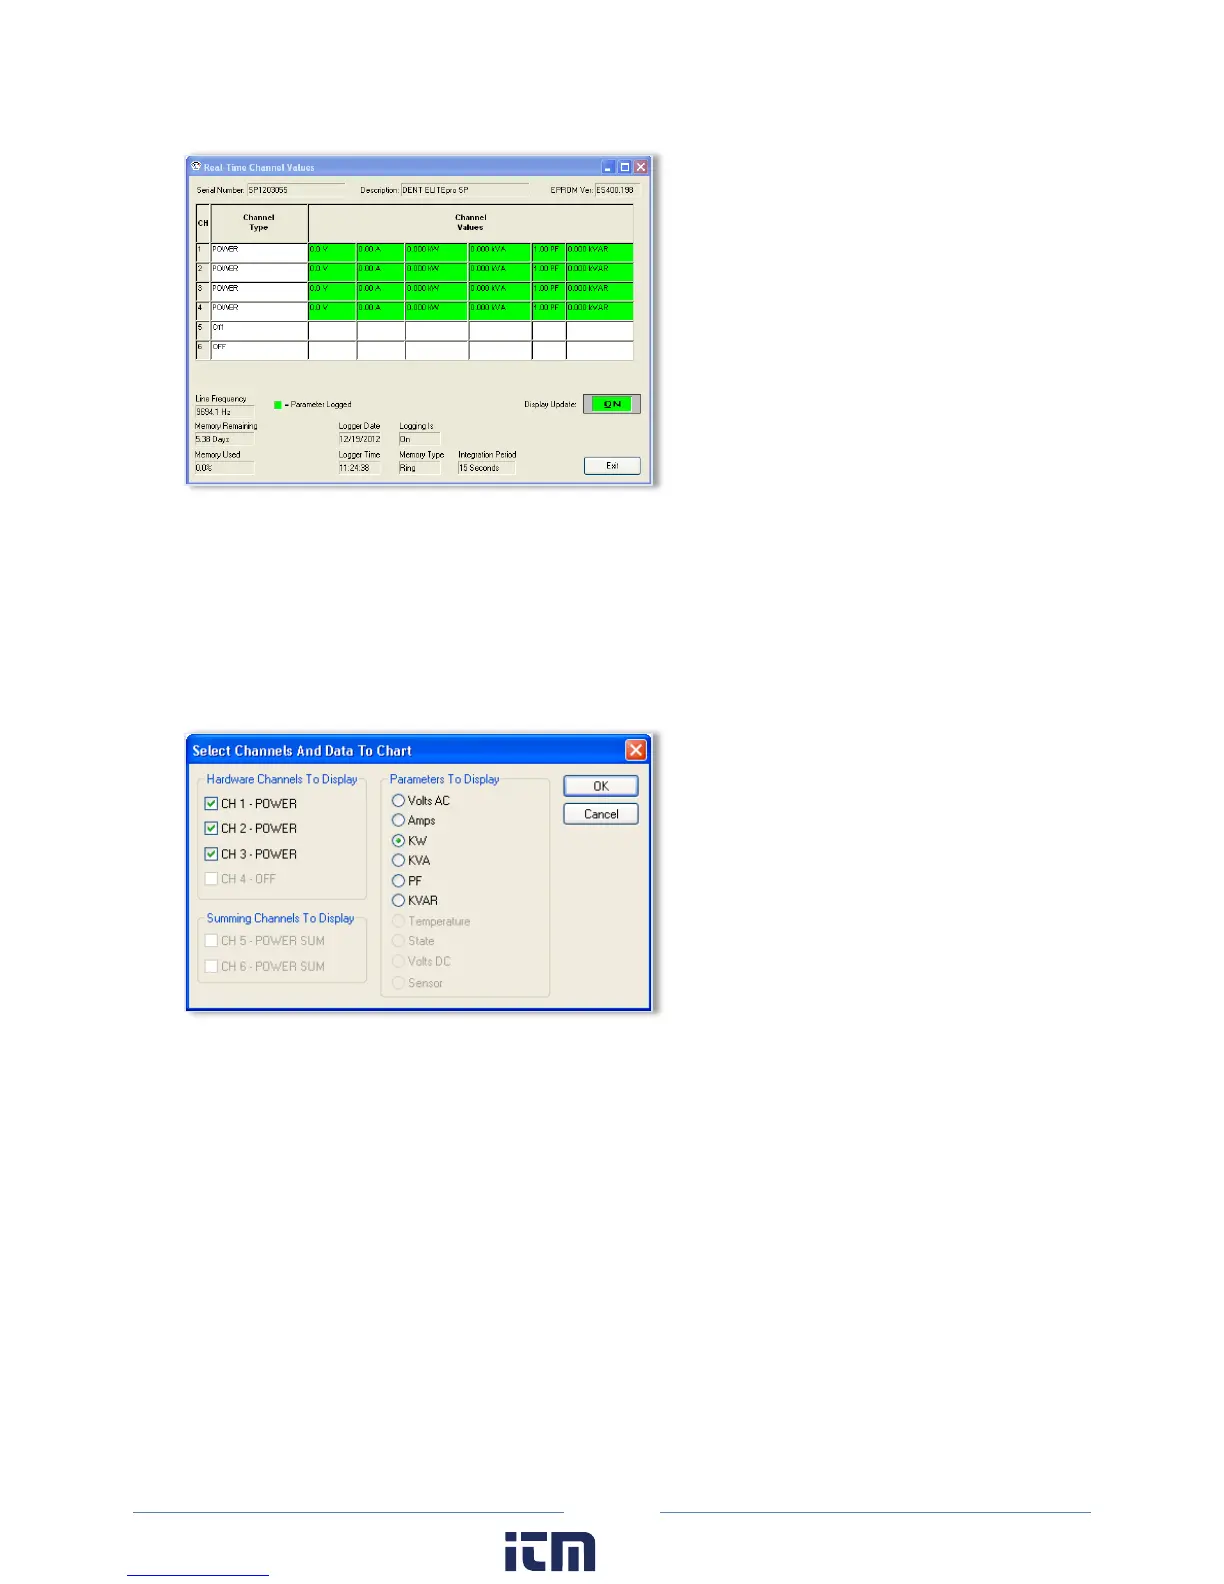
Show As Graphs
This menu selection displays the data as a graph instead of the text format described previously.
Select Logger > Display Real-Time Values > Show as Graphs to display the following dialog box.
1) Select any or all physical power channels currently turned on in the logger in the Hardware
Channels To Display section.
-or-
Select one or both calculated power channels currently turned on in the logger in the Summing
Channels To Display section.
Selecting a power channel activates the Parameters To Display option. You can only select one variable
at a time to graph. This is not like a text display option where parameters are viewed simultaneously.
This is due to differences in scaling and to reduce clutter on the graph. For example, you could display
kW from four channels simultaneously but not a kW and a KVAR even if it is from the same channel.
2) Select a parameter to chart.
3) Select OK to view the graph.
w ww. . com
information@itm.com1.800.561.8187