EasyManuals Logo
Home>DENT Instruments>Data Loggers>ELITEpro XC

DENT Instruments ELITEpro XC User Manual

DENT Instruments ELITEpro XC
138 pages
To Next Page IconTo Next Page
To Previous Page IconTo Previous Page
Page #76 background imageLoading...
Page #76 background image
76
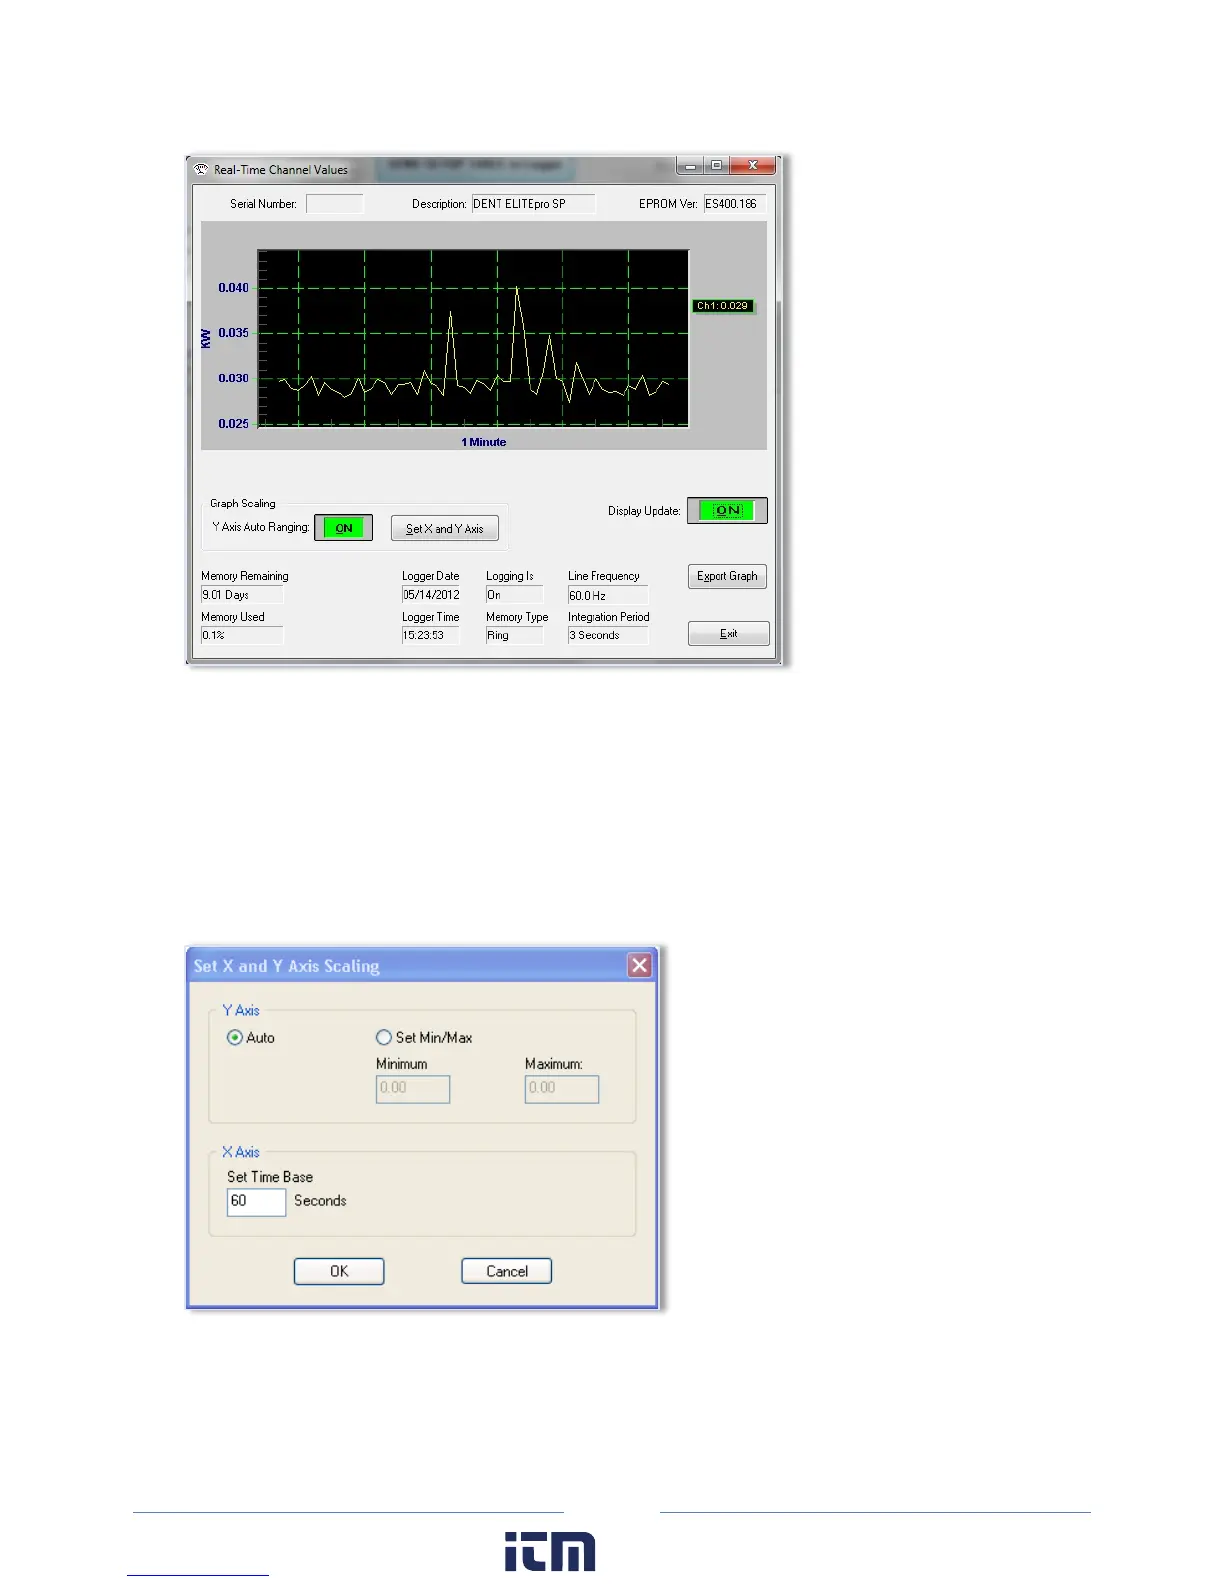
The graph presentation is very similar to paper strip chart recorders. The graph begins on the left
edge and moves to the right. When it reaches the right edge, the entire graph scrolls to the left with
each new reading. This always displays the most current data values and the older points slide off
the left edge.
Use Set X and Y Axis to set the scaling and the line type (e.g., linear or logarithmic). You can also set
the amount of time data is graphed. This can vary from 1 second to more than 18 hours (65,000
seconds). Note that the X-axis scaling is only approximate.
w ww. . com
information@itm.com1.800.561.8187

Table of Contents

Other manuals for DENT Instruments ELITEpro XC

Questions and Answers:

Question and Answer IconNeed help?

Do you have a question about the DENT Instruments ELITEpro XC and is the answer not in the manual?

DENT Instruments ELITEpro XC Specifications

General IconGeneral
BrandDENT Instruments
ModelELITEpro XC
CategoryData Loggers
LanguageEnglish