Commissioning Smartec S CLD134
48 Endress+Hauser
Value entry
Enter the three characteristic values for each measured sample in the fields K6 to K8 (value triplets
of conductivity, temperature and concentration).
• Variable process temperature:
Enter at least four value triplets.
• Constant process temperature:
Enter at least two value triplets.
!
Note!
• Please make sure that the concentrations and temperatures measured for your samples
correspond to the measuring range of the process. If the measured values of the process are
outside the range of your sample values, this considerably reduces the level of accuracy and the
error messages E078 or E079 will be displayed.
If you enter an additional value triplet of 0 μS/cm and 0 % for each temperature used, you can
work from the start of measuring range with sufficient accuracy and without an error message.
• In case of concentration measurement, temperature compensation is automatically performed
using the entered table values. Therefore, the temperature coefficient set in the SETUP 2 function
group is not active.
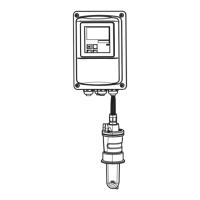
C07-CLD132xx-05-06-00-xx-012.eps
Fig. 39: Measured data for variable process temperatures (example)
κ
C
T
Conductivity
Concentration
Temperature
1
2
Measuring point
Measuring range
C07-CLD132xx-05-06-00-xx-015.epsB
Fig. 40: Measured data for a constant process temperature (example)
κ
C
Conductivity
Concentration
T
1
Constant temperature
Measuring range
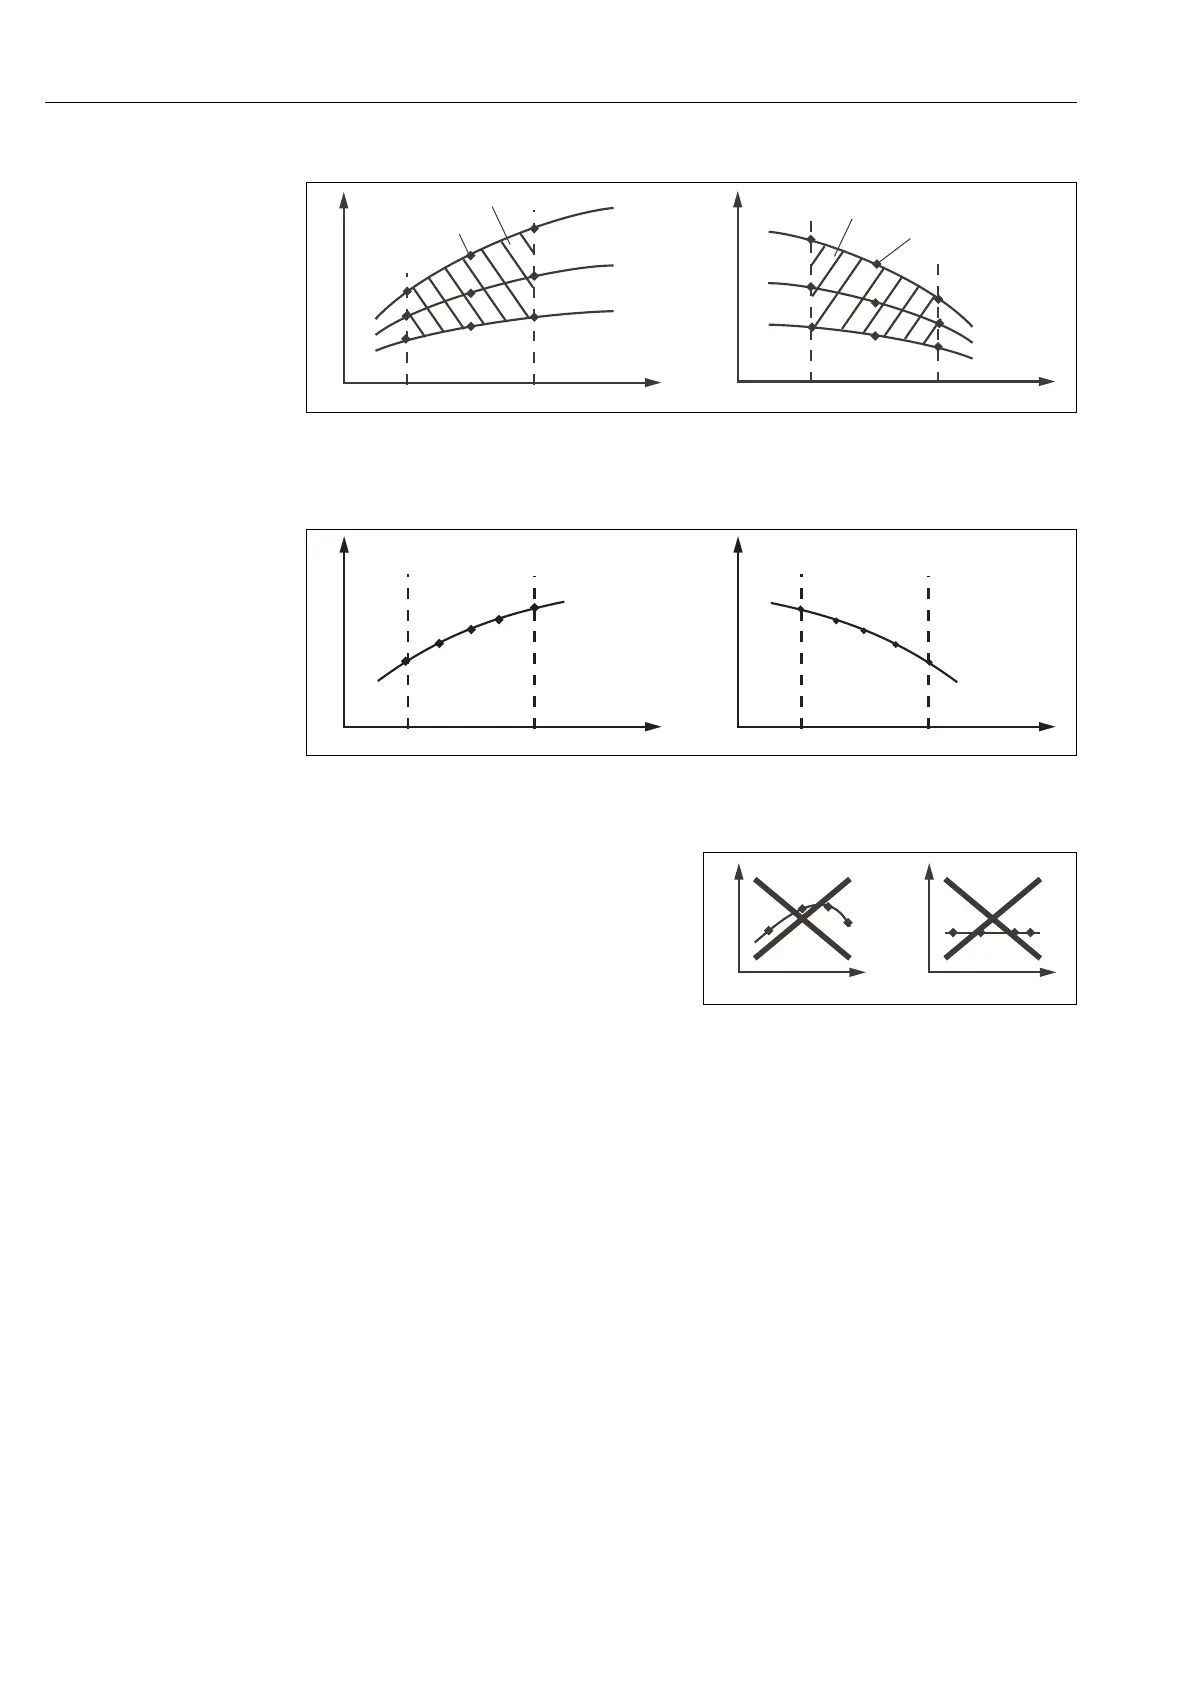
The characteristics received from the measuring
points must be strictly monotonously increasing
or strictly monotonously decreasing in the range
of the process conditions. Therefore, neither
maxima / minima nor ranges with a constant
behaviour can occur. Curve profiles such as
those in Fig. 41 are not permitted.
C07-CLD132xx-05-06-00-xx-016.eps
Fig. 41: Impermissible curve profiles
κ Conductivity
CConcentration
κ
κ
CCC
min
C
min
T
1
T
1
T
2
T
2
T
3
T
3
C
max
C
max
2
2
1
1