Results from iMiniPlus 37
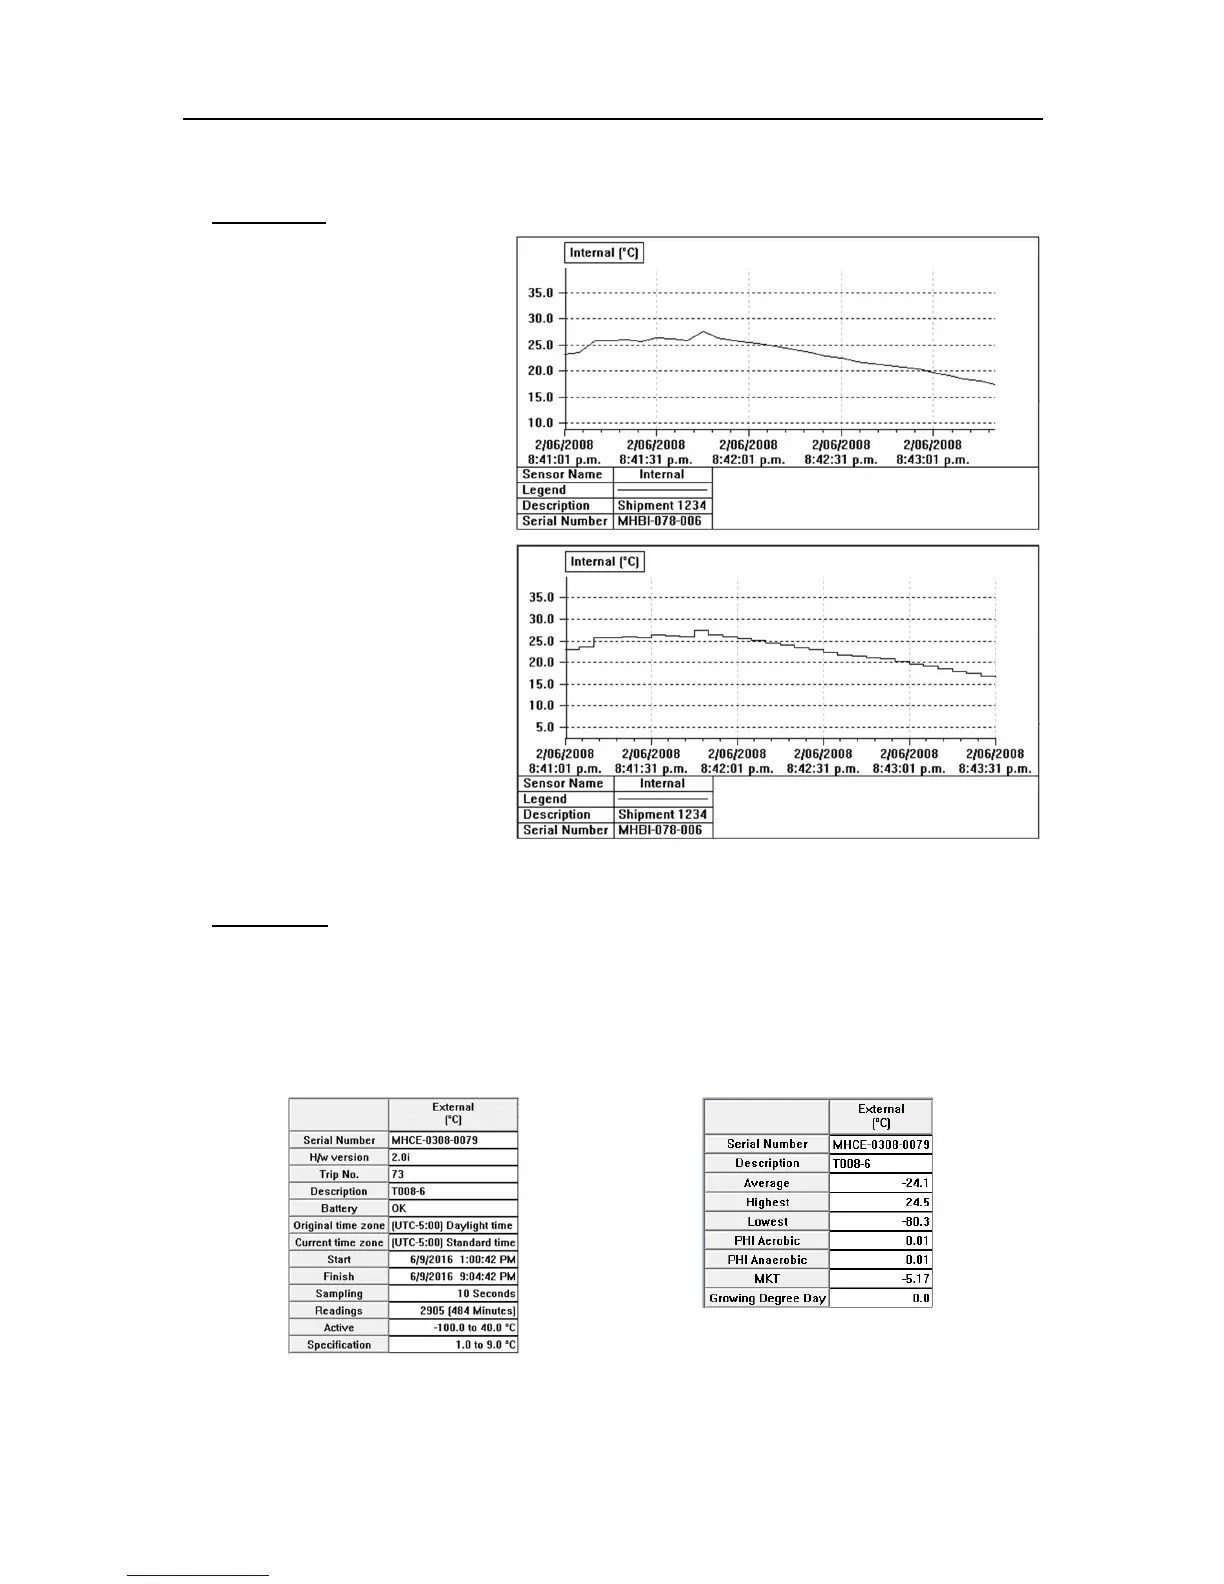
2D Graph.
Line - displays the logger’s reading
as a line graph.
Step - displays the logger’s readings
as a step graph.
You can enlarge a section of the
graph with the mouse. Move the
mouse to one corner of the area you
want to zoom, press the left mouse
button, drag the mouse to the
opposite corner, and release the
button to enlarge a section of the
graph. Press the toolbar zoom button
or right click the mouse to restore
(un-zoom) the graph.
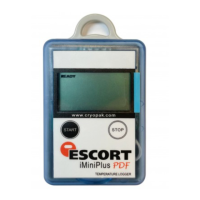
Summary.
Overview - displays overview information
of the current logger such as serial
number, trip number, battery report, time
zone, start and finish dates, number of
readings, readings interval, logger’s
range and specification.
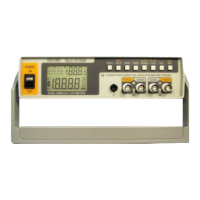
Statistics - displays the serial number, the
description, the highest and the lowest value
of readings, the average value of readings,
the Process Hygiene Index (PHI), Mean
Kinetic Temperature (MKT), a Custom value
and Grower Degree Day (GDD).