Results from iMiniPlus 43
GDDs are typically measured from the winter low. Any temperature below
T
base
is set to
T
base
before
calculating the average. Likewise, the maximum temperature is usually capped at 30 °C because most
plants and insects do not grow any faster above that temperature. However, some warm temperate and
tropical plants do have significant requirements for days above 30 °C to mature fruit or seeds.
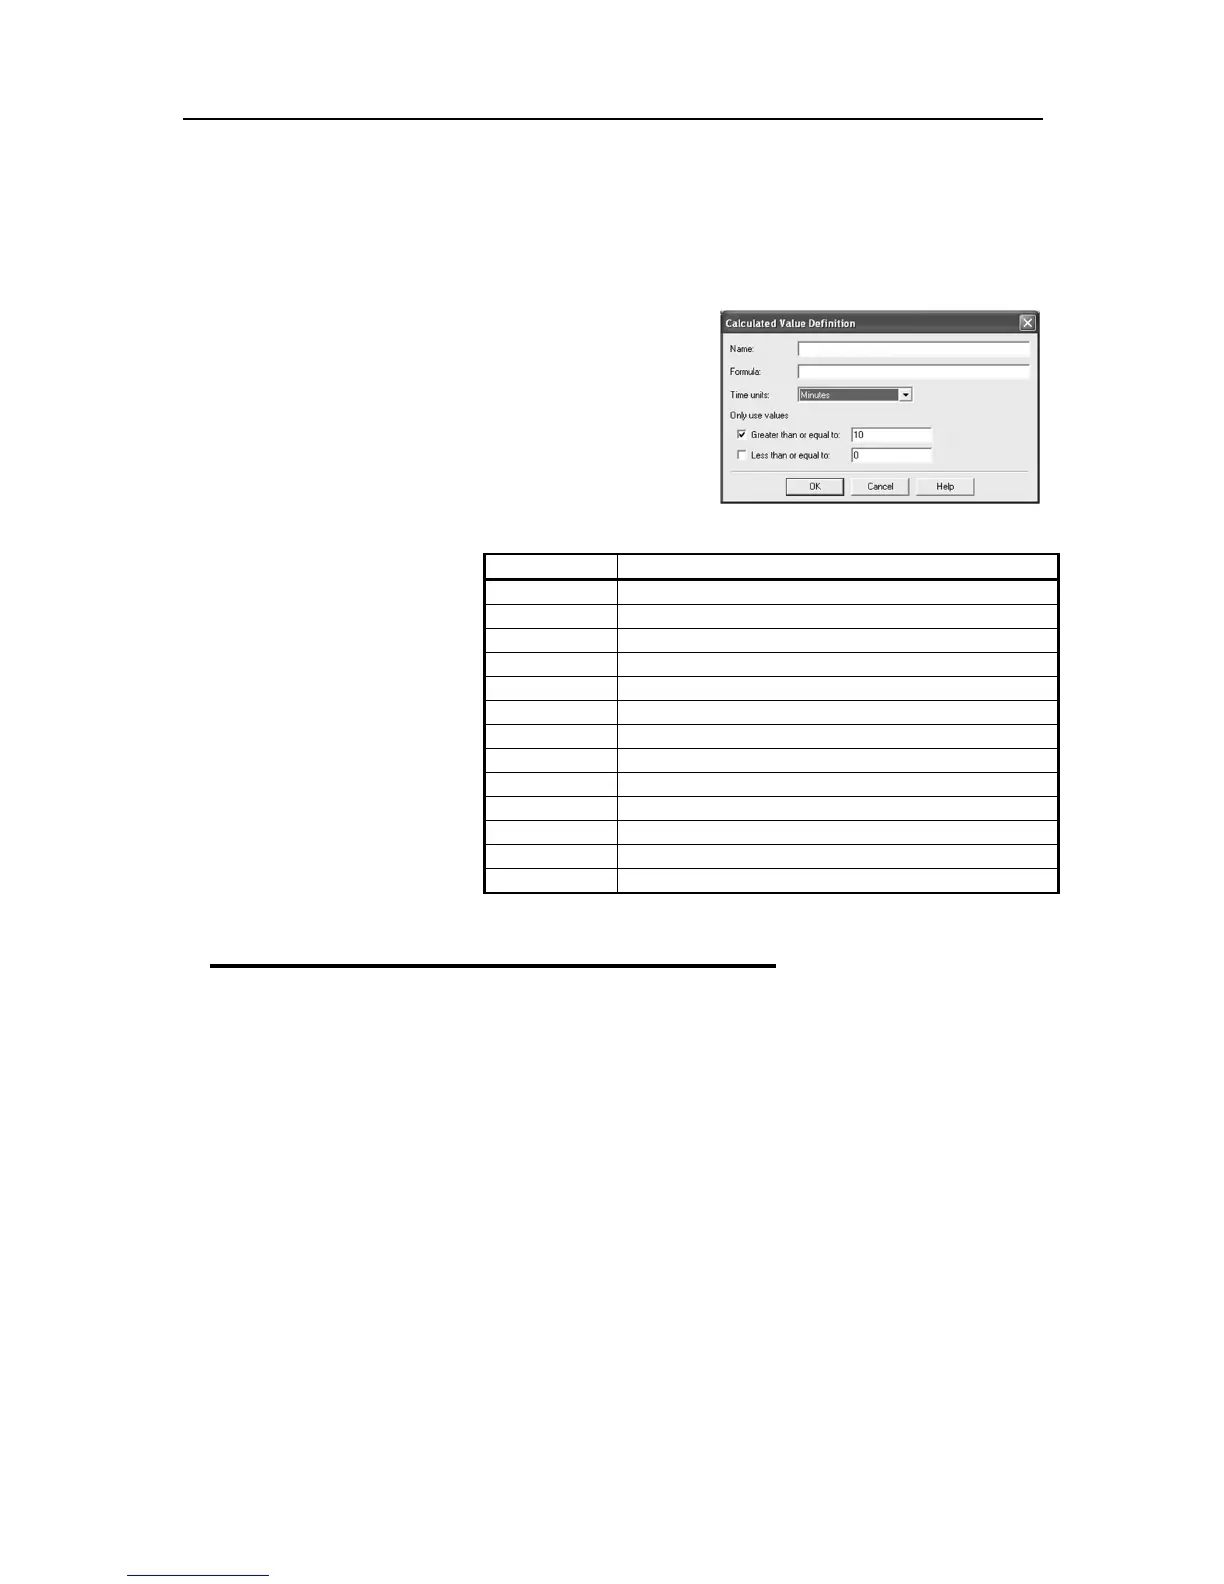
Custom Value
Select this option to display custom defined value of readings in
the graph’s Legend. Double clicking on the Custom item opens
the Calculated Value Definition dialog box.
Name
- any name you wish. For example, ‘’Calculated fresh
value of food’’.
Formula
- enter the formula used to convert each sensor’s
reading into the calculated
value.
Example:
The value of fresh food is given
as:
Fresh Value = (Measured
Temperature - Target
Temperature) * Time
Assume the Target Temperature
is 60°C.
Set the Formula to $ - 60.
Set the Time Units to hours.
Select Greater than or equal to
option and set limit to 60.
The mathematical operations
currently supported include:
View Data in a Graph
Open the data either from downloading an iMiniPlus or from a saved file. When the data opens it will
present a List and Summary Report. Go to the View Manager and select the View tab. Then select 2D
graph either Line or Step. The graph will presented like below:
where to put sensor value into the formula