46
Vertical (Y) Axis
This enables you to fill the graph from the left or right or use both sides of the graph.
Border Colors
This enables you to select border colors for your graph.
Vertical (Y) Axis Limits
This enables you to display the graph Y-axis (temperature readings) to fit either the complete range of the
sensor (-40°C to +70°C) or within the alarm limits (if programmed) or from 0°C to the actual readings.
Select the Apply button to update the 2D graph.
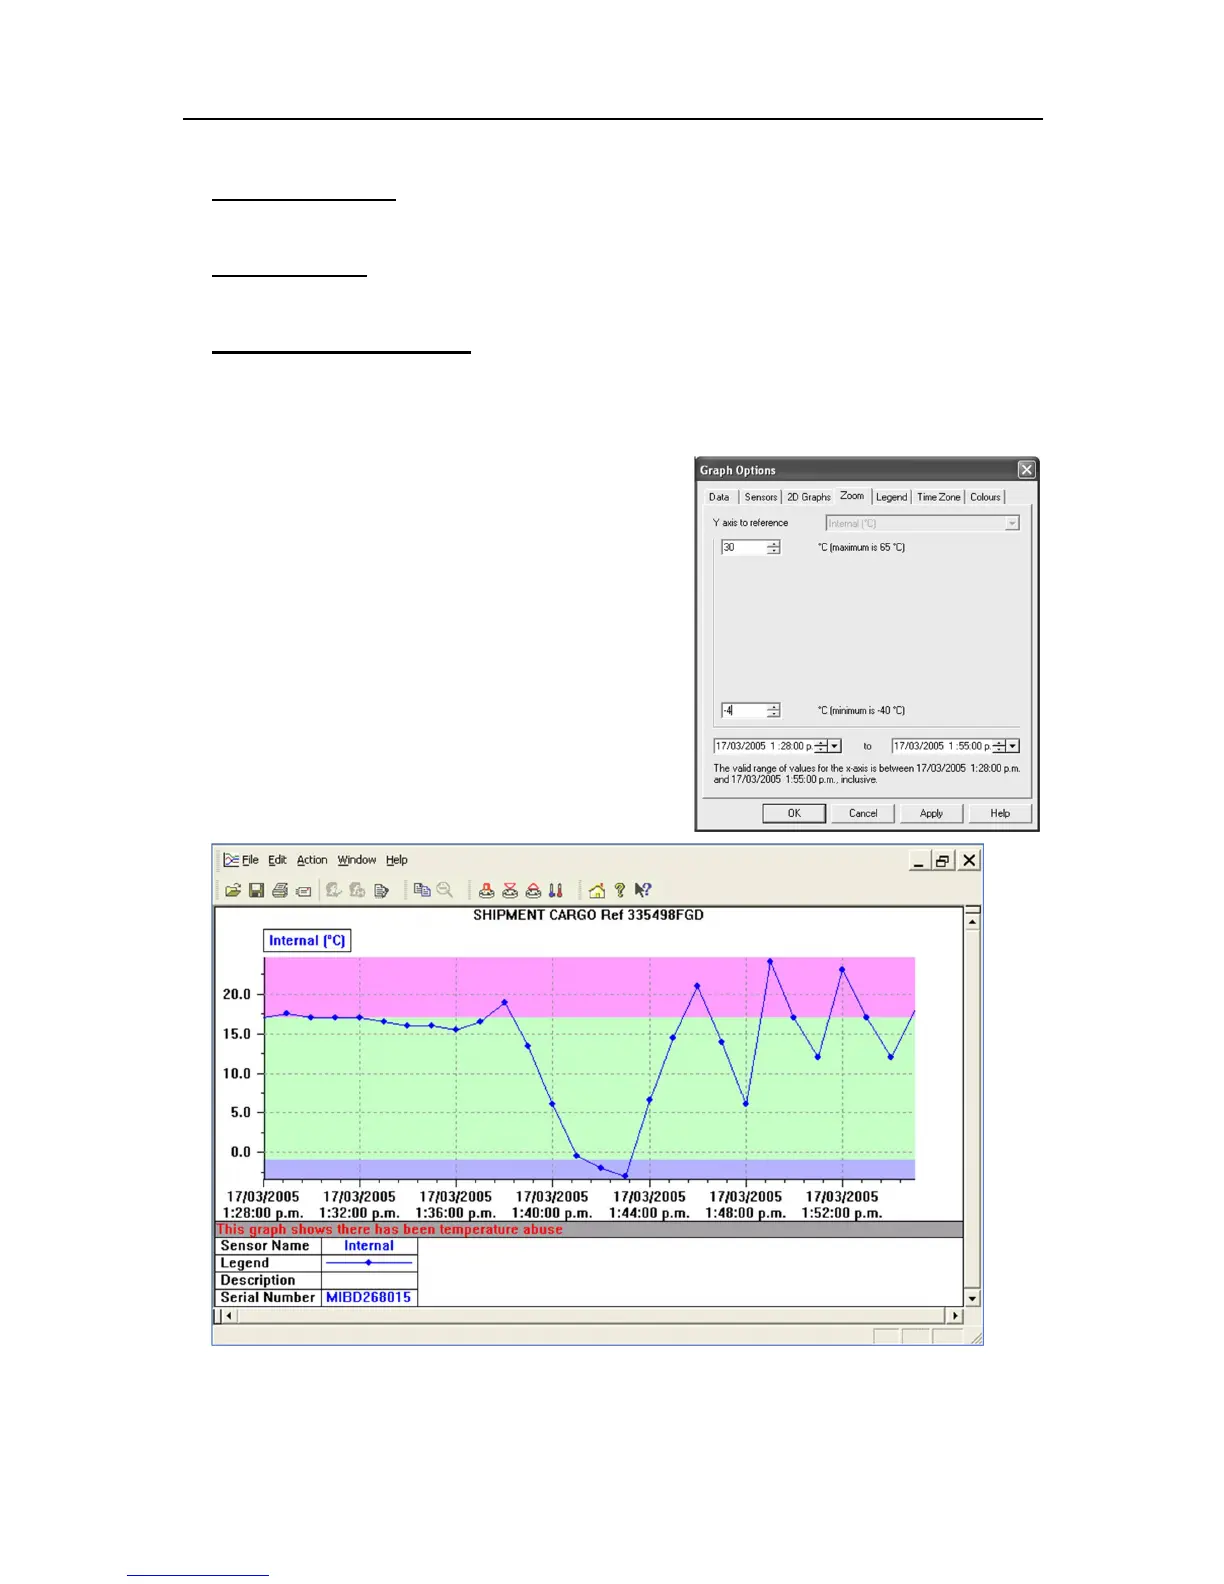
Zoom
The Zoom feature allows you to manually adjust the
temperature and time co-ordinates to select certain areas of
interest. In this example +30°C and -4°C have been
selected.