52
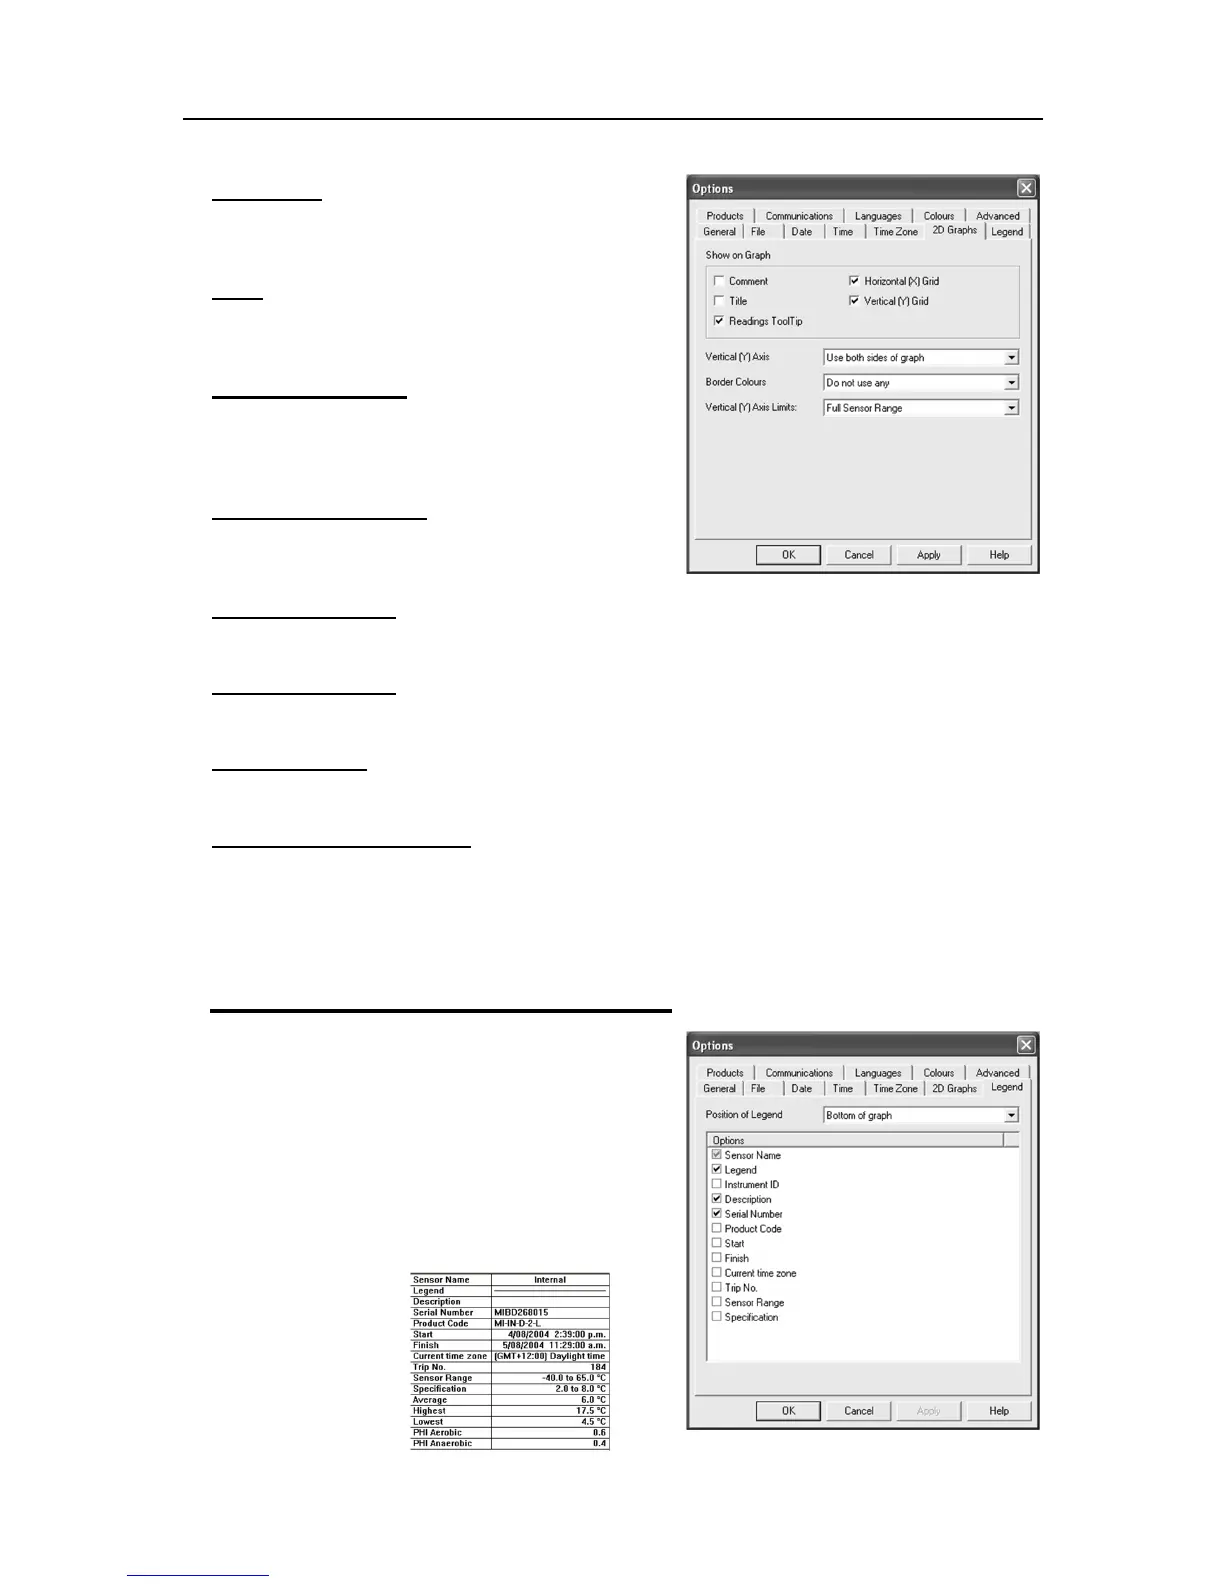
Comment
Select this box if you want to display the comment line on
the bottom of the graph
Title
Select this box if you want to place a title on the top of the
graph.
Readings ToolTip
Select this box if you want the Tooltip box to open next to
the mouse cursor on the graph. The box will show the
date, time and reading at any point along the x-axis.
Horizontal (X) Grid
Select this box if you want to display a dashed horizontal
grid on the graph.
Vertical (Y) Grid
Select this box if you want to display a dashed vertical grid on the graph.
Vertical (Y) Axis
This enables you to fill the graph from the left or right or use both sides of the graph.
Border Colors
This enables you to select border colors for your graph.
Vertical (Y) Axis Limits
This enables you to display the graph Y-axis (temperature readings) to fit either the complete range of the
sensor (-40°C to +70°C) or within the alarm limits (if programmed) or from 0°C to the actual readings.
Select the
Apply
button to update the 2D graph.
For more information about how to create and customize graphs, see section
View Data in a Graph
Legend
Each graph generated has a legend that information can
be added to.
The legend can be positioned at the top, bottom, left and
right of the graph. Or omitted altogether. As well as the
above Legend options, the various Calculated values
and/or Custom value can be displayed. See
Analysis
in
the
View Manager
section. These values can be selected
or deselected from the Manager while the 2D graph is
displayed.