87
Within display
modes ‘Day /
Year / Total’
displayed data
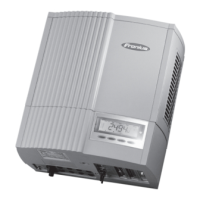
Energy supplied
energy supplied during monitored
period (kWh / MWh)
Due to the variety of different monitoring systems, there can be deviations
between the readings of other metering instruments as compared to the
readings from the Fronius IG Plus. For determining the energy supplied to
the grid, only the readings of the calibrated meter supplied by the electric
utility company are relevant.
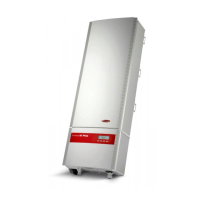
Yield
money earned during monitored
period (set currency and price per
kWh in setup menu)
As was the case for the energy supplied, readings may differ from those
of other instruments.
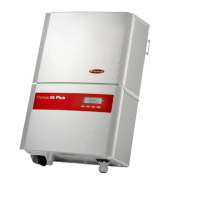
CO
2
reduction
CO
2
emissions avoided during monitored period (lb / T); T = tons
The area for unit display switches between ‘lb’ and ‘CO2’.
The CO
2
meter gives an indication of CO
2
emissions (in lb/t) that would be
released during the generation of the same amount of electricity in a
combustion power plant.
This is set for 1.3 lb/kWh in the factory.
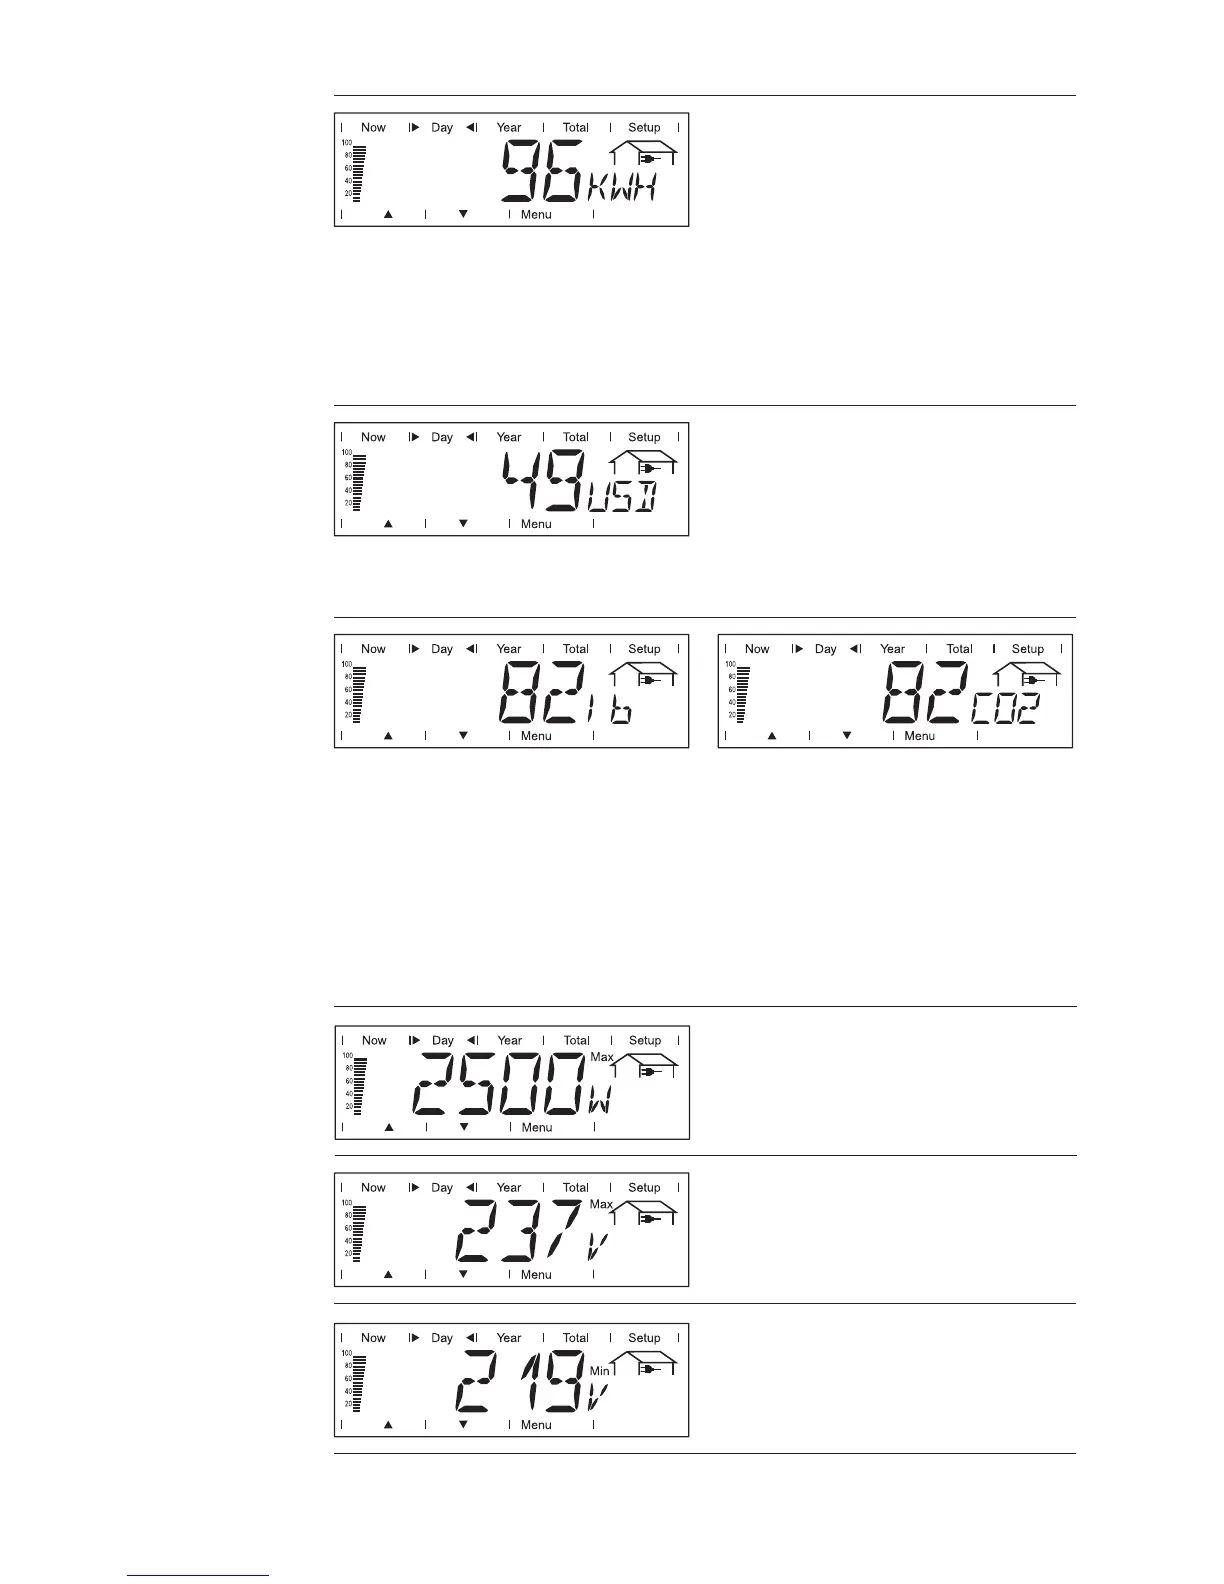
Maximum output power
highest output power of the Fronius
IG Plus during observation period
(Watts)
Maximum grid voltage
highest reading of grid voltage (V)
during observation period
Minimum grid voltage
lowest reading of grid voltage (V)
during observation period