e.bloxx A6-2CF
MEASUREMENTS
HB_EBLOXX-A62CF_E_V19.doc
31
Gantner Instruments Test & Measurement GmbH
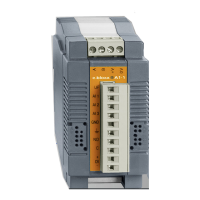
Picture 4.17.
Signal diagram for frequency measurement
The frequency measurement is working on the base of counting input pulses during a selectable time.
The Resolution of the frequency measurement can be calculated:
R = T / f
R...Resolution
T... Time base
f ... Input frequency
Is the time base selected e. g. 2 s, at a input frequency of 2000 Hz a counter value of 4000 will be reached. The
frequency measurement can be done in 0.5 Hz steps, e.g. 1854.5 Hz. The resolution in this case is 0.5 Hz / 2000 Hz =
0.025 %. Will the time base be selected at 5 s at the same input frequency, the counter value will reach 10000 and the
displaying can be done in 0.2 Hz steps, the resolution will be 0,01 %.
It is advisable, to select a time base as long as possible from the application side to reach a high resolution.
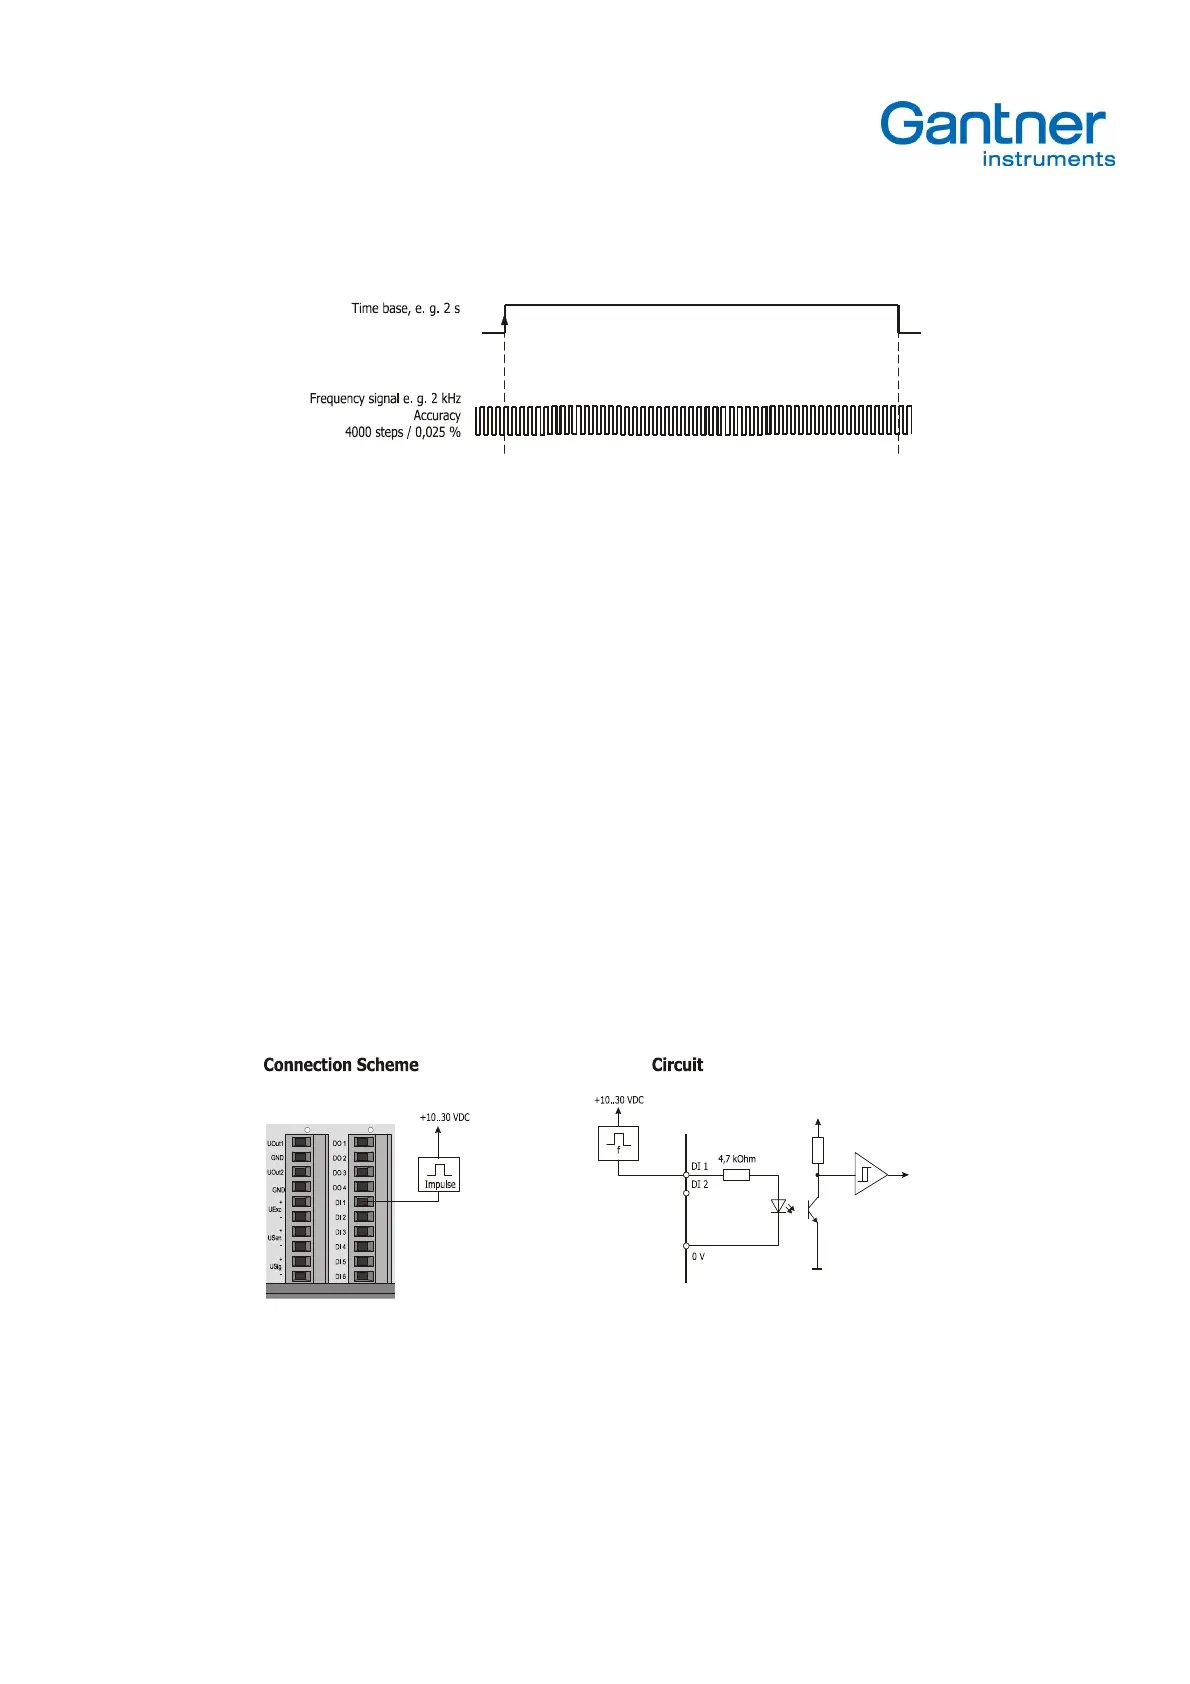
4.4.3. Counter
Picture 4.18.
Connection scheme and circuit for counter