GPT-10000 Series User Manual
106
2. Use the scroll wheel to move the
cursor on the time axis (red
highlight in x-axis). The measured
values on the green and blue lines
at that particular point in time are
shown within the table below
(orange highlight). Also, the test
function along with the test number
is clearly shown within the table.
The HI in y-axis (yellow highlight)
along with the dotted line in red
indicates the HI SET value and the
point of tripped time.
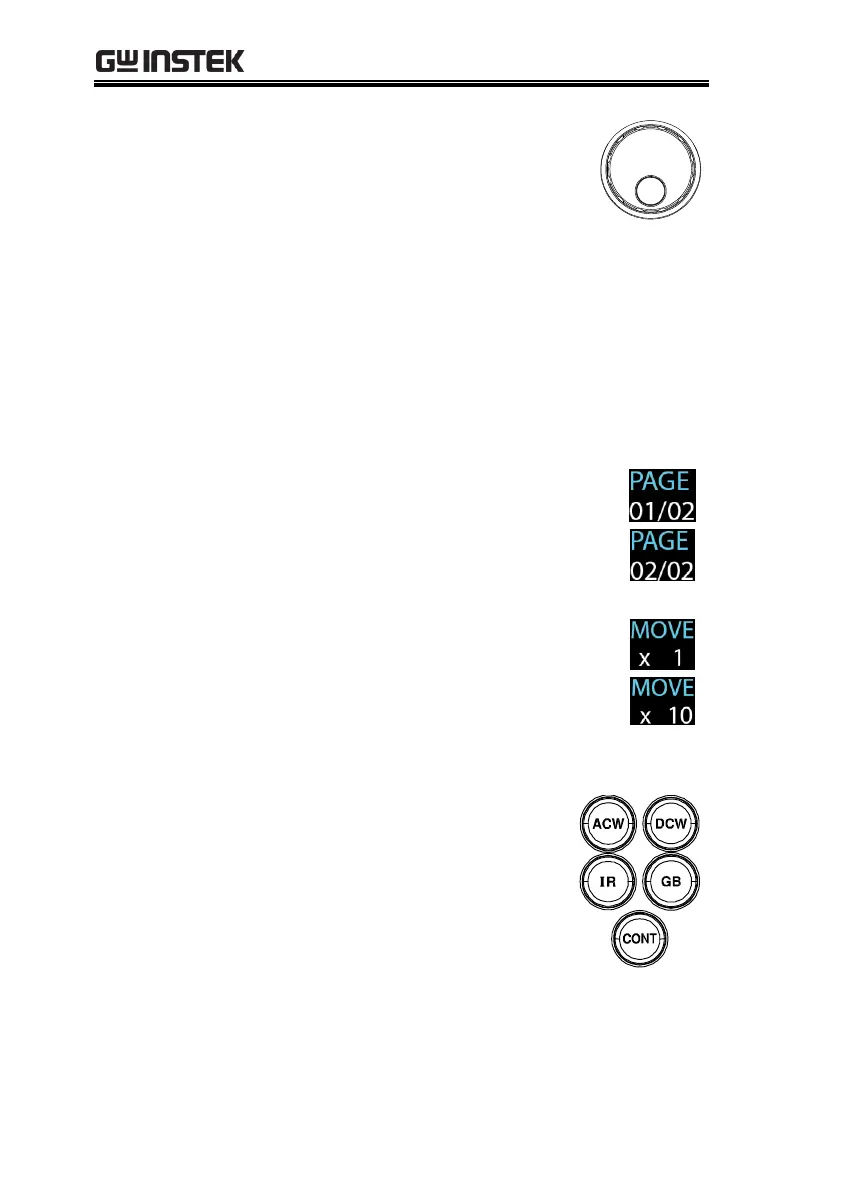
3. The resultant graph will be over 1 page
when test time is beyond 650 steps (the
interval of each step is 0.1s). In this
case, press PAGE soft-key to switch
among each page for full graphs.
4. Press the MOVE soft-key before
moving the cursor to fast-forward
steps by 10 times (x 10), which is
practical when steps are many. Press
the MOVE soft-key again to return
back to the normal “x 1” speed.
To exit the sweep graph, press
the corresponding button again
to return back to Manual test.
 Loading...