Wi-Fi 6 2x2:2 User Manual Rev: A0-00
82
CONFIDENTIAL
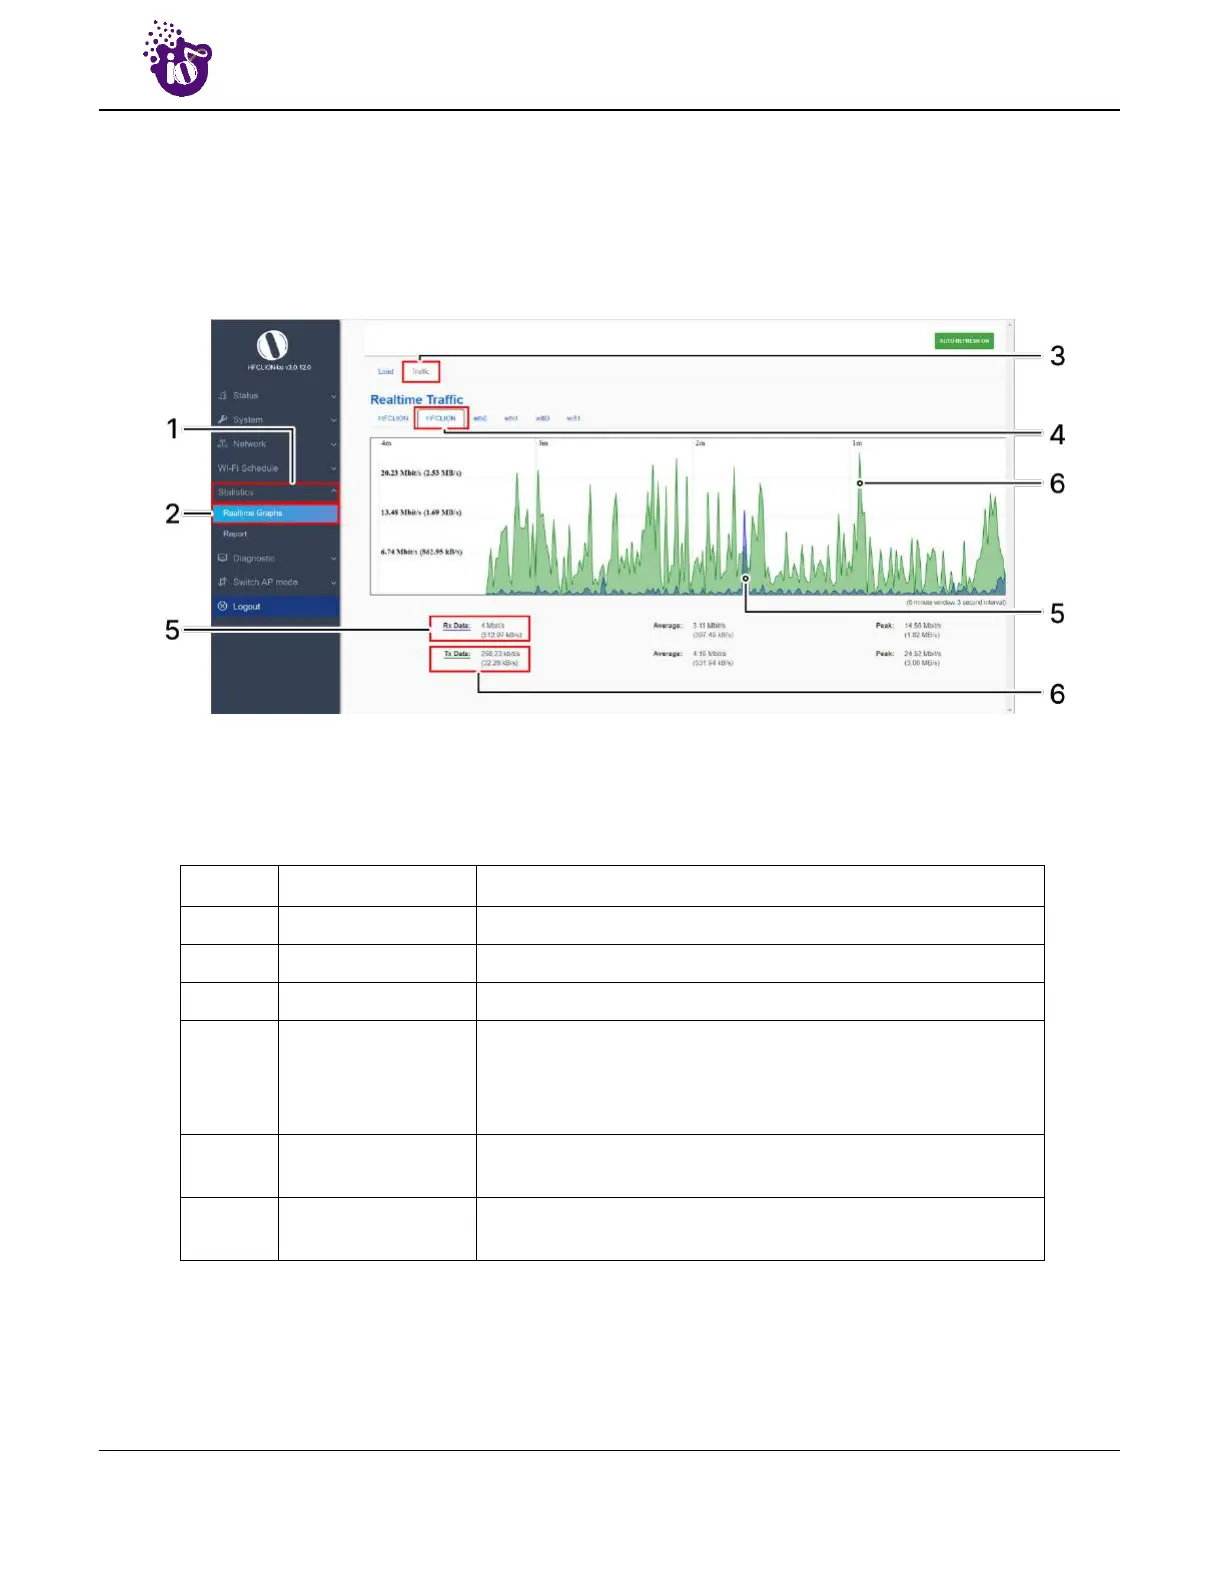
13.2 Real-time Graphs/Traffic
The real time load/traffic graph shows the CPU load of last 3 min and the graph is refreshed at every 3 sec
interval. In addition to the displayed graph the user can find the inbound and outbound traffic of the
associated SSIDs, bridge interface, and Ethernet interfaces along with average and the peak traffic values. A
basic overview of the Real-time graphs traffic screen is given below:
Figure 50: Basic overview of the Real-time graphs/ traffic
Follow the steps given below to view the real-time traffic graphs of the AP:
Table 40: List of actions to view real-time traffic graphs
Callout Name Description
1. Statistics Click on “Statistics” dropdown
2. Real-time graphs Click on “Real-time graphs” option
3. Real-time Traffic Click on the traffic option to view the traffic statistics
4. Real-time Traffic
Select any of the interface to check the inbound and outbound
traffic across it. The graphs are available to show the traffic
across SSIDs, Bridge Interface, and Ethernet Interface (eth-0
and eth-1)
5. Inbound
Displays the inbound traffic at the selected interface in color
coded format
6. Outbound
Displays the outbound traffic at the selected interface in color
coded format
 Loading...