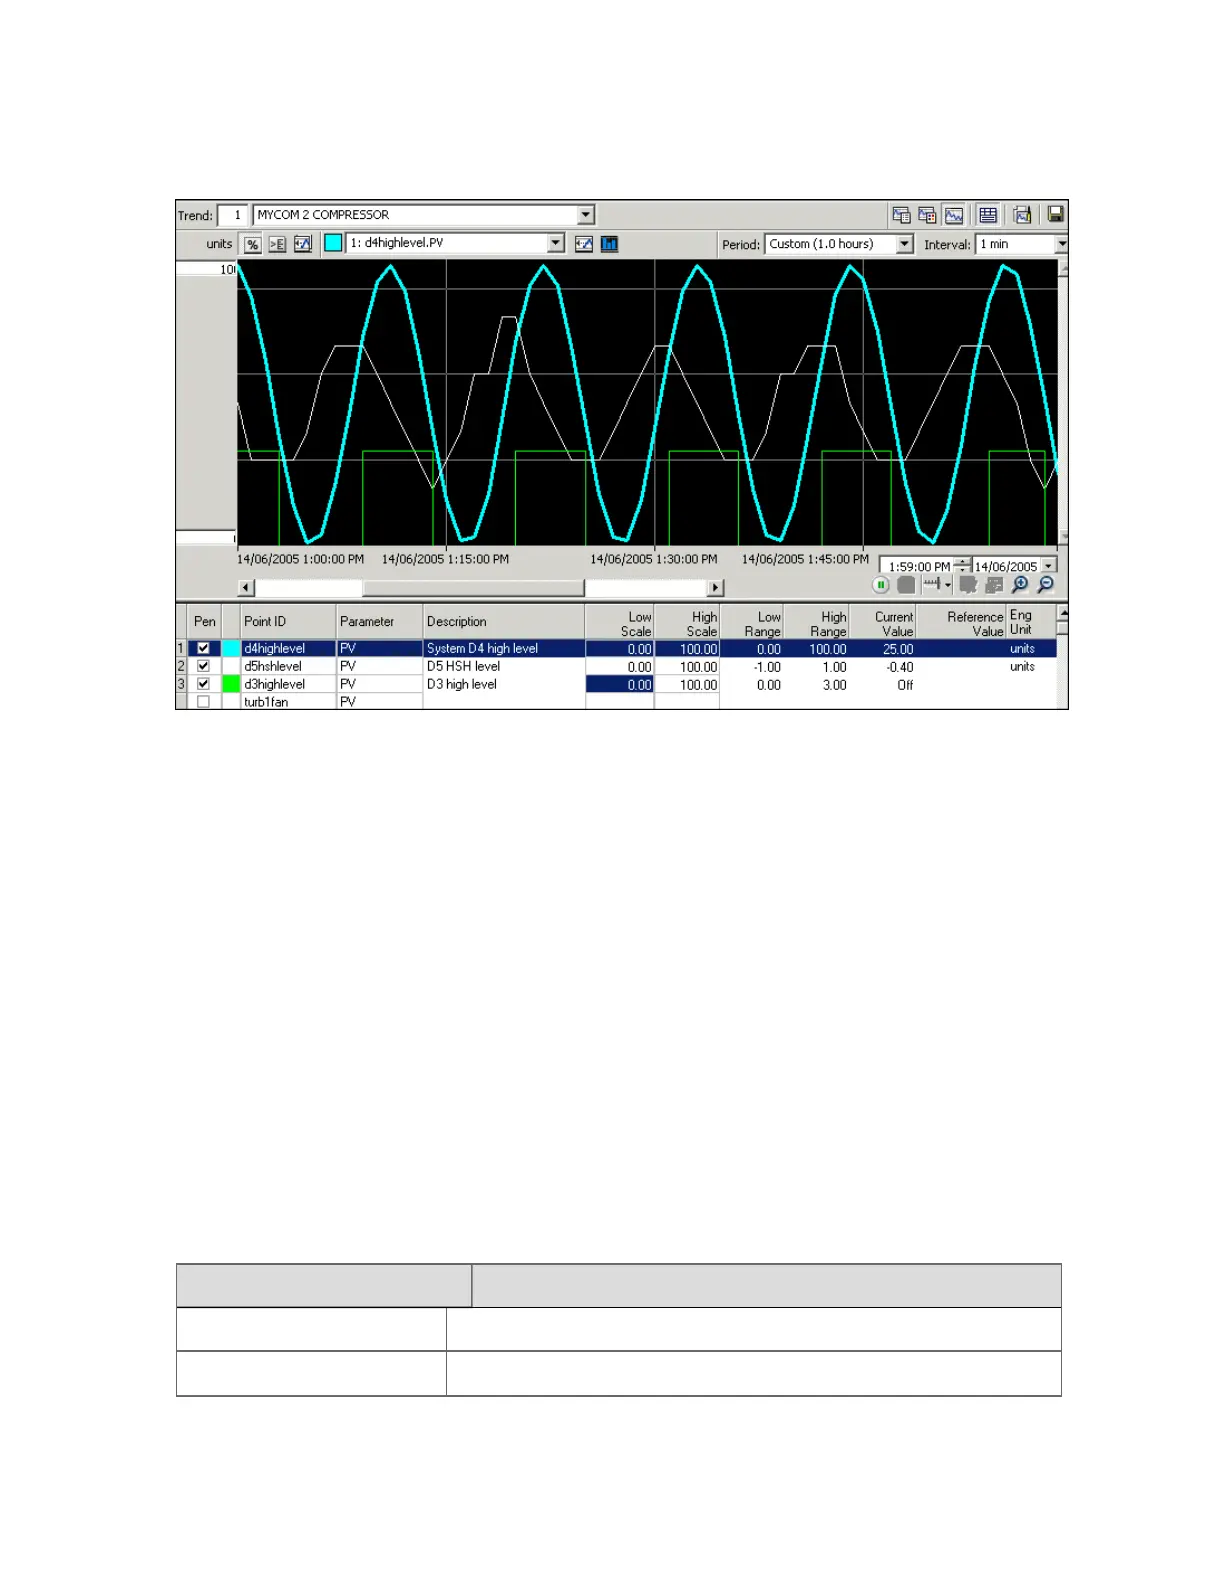
Typical trend
Standard trends and limit trends display historical data for up to 32 points as line graphs. In
addition to the line graph, you can choose to display numeric history for the points in the
trend as well as events associated with the points in your trend.
You can configure your trend so that the data is displayed as:
n
A bar graph for up to three points
n
An X-Y plot for two analog points, with one point's values plotted against the other.
Scanning strategy
Scanning is the process by which the server reads from/writes to memory locations in
controllers other than Process Controllers.
Each item of controller data to which the server needs read/write access is defined in the
server as a point parameter. For example, the temperature of a boiler would typically be
represented in the server as the PV (process variable) of an analog point.
An efficient scanning strategy provides the required level of monitoring and control, while
keeping system load to a minimum.
IssueComments
Basic principles Ensure that your strategy conforms to the basic principles.
Scanning techniques Use scanning techniques that are appropriate to your needs.
Points
Honeywell 2017 68
 Loading...