13-2
Managing Switches
Displaying Switch Status
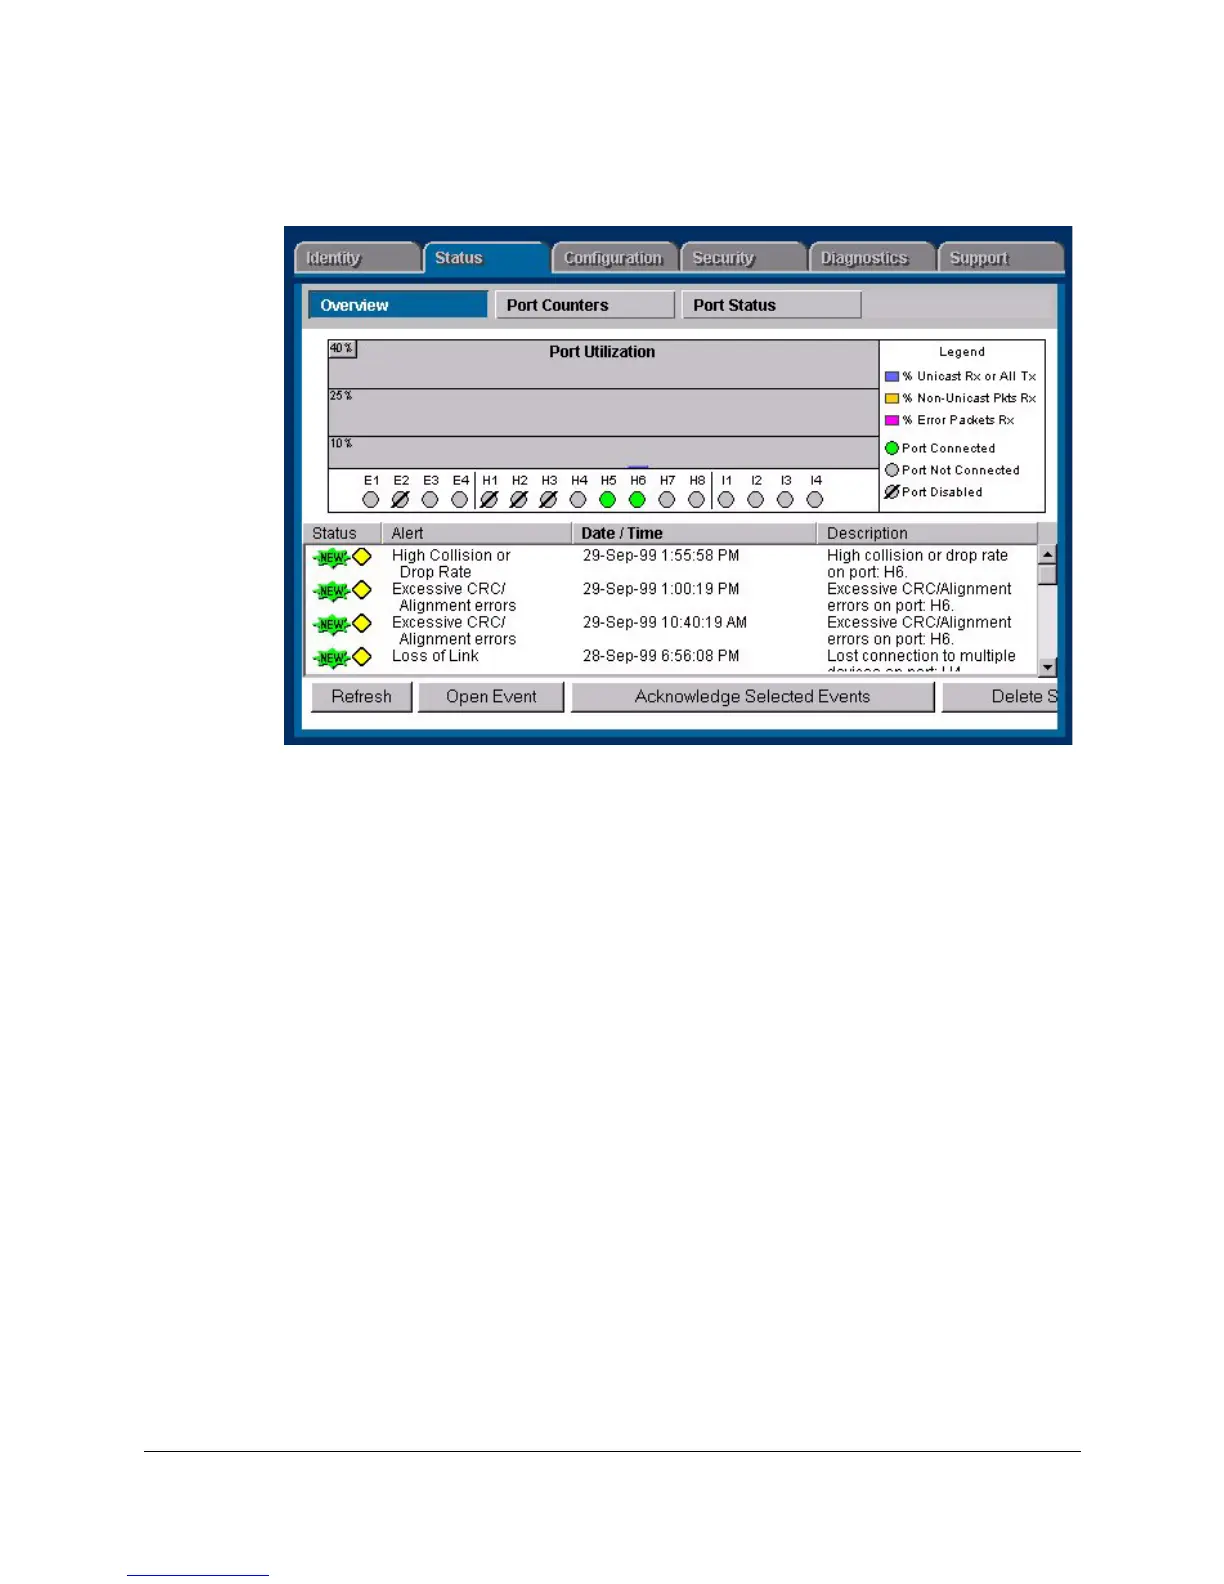
Figure 13-1. Status Overview Page
Graph Area
The bar graph gives a quick overview of the performance of the switch. Each
bar shows the highest percentage of transmitted (TX) or received (RX) traffic
utilization for that port in the last five seconds.
The graph area proportionally depicts three attributes for each port:
■ Unicast packets—The percent utilization for packets that were not
addressed to a multicast or broadcast address.
■ Non-Unicast packets—The percent utilization of received non-unicast
packets (both broadcast and multicast). If there is a broadcast storm, only
the port receiving these packets shows high utilization, letting you quickly
pinpoint the problem.
■ Errors—The percent utilization for error packets received. A high
percentage may indicate possible network problems.
Place the cursor over a bar in the graph to display the exact percentages for
each attribute and to display the speed of that port.
The graph only scales to 40% utilization. Network utilization above this level
indicates serious performance problems.
The graph also shows you if a port is active, disabled, or not connected.