9-8
Monitoring Network Traffic
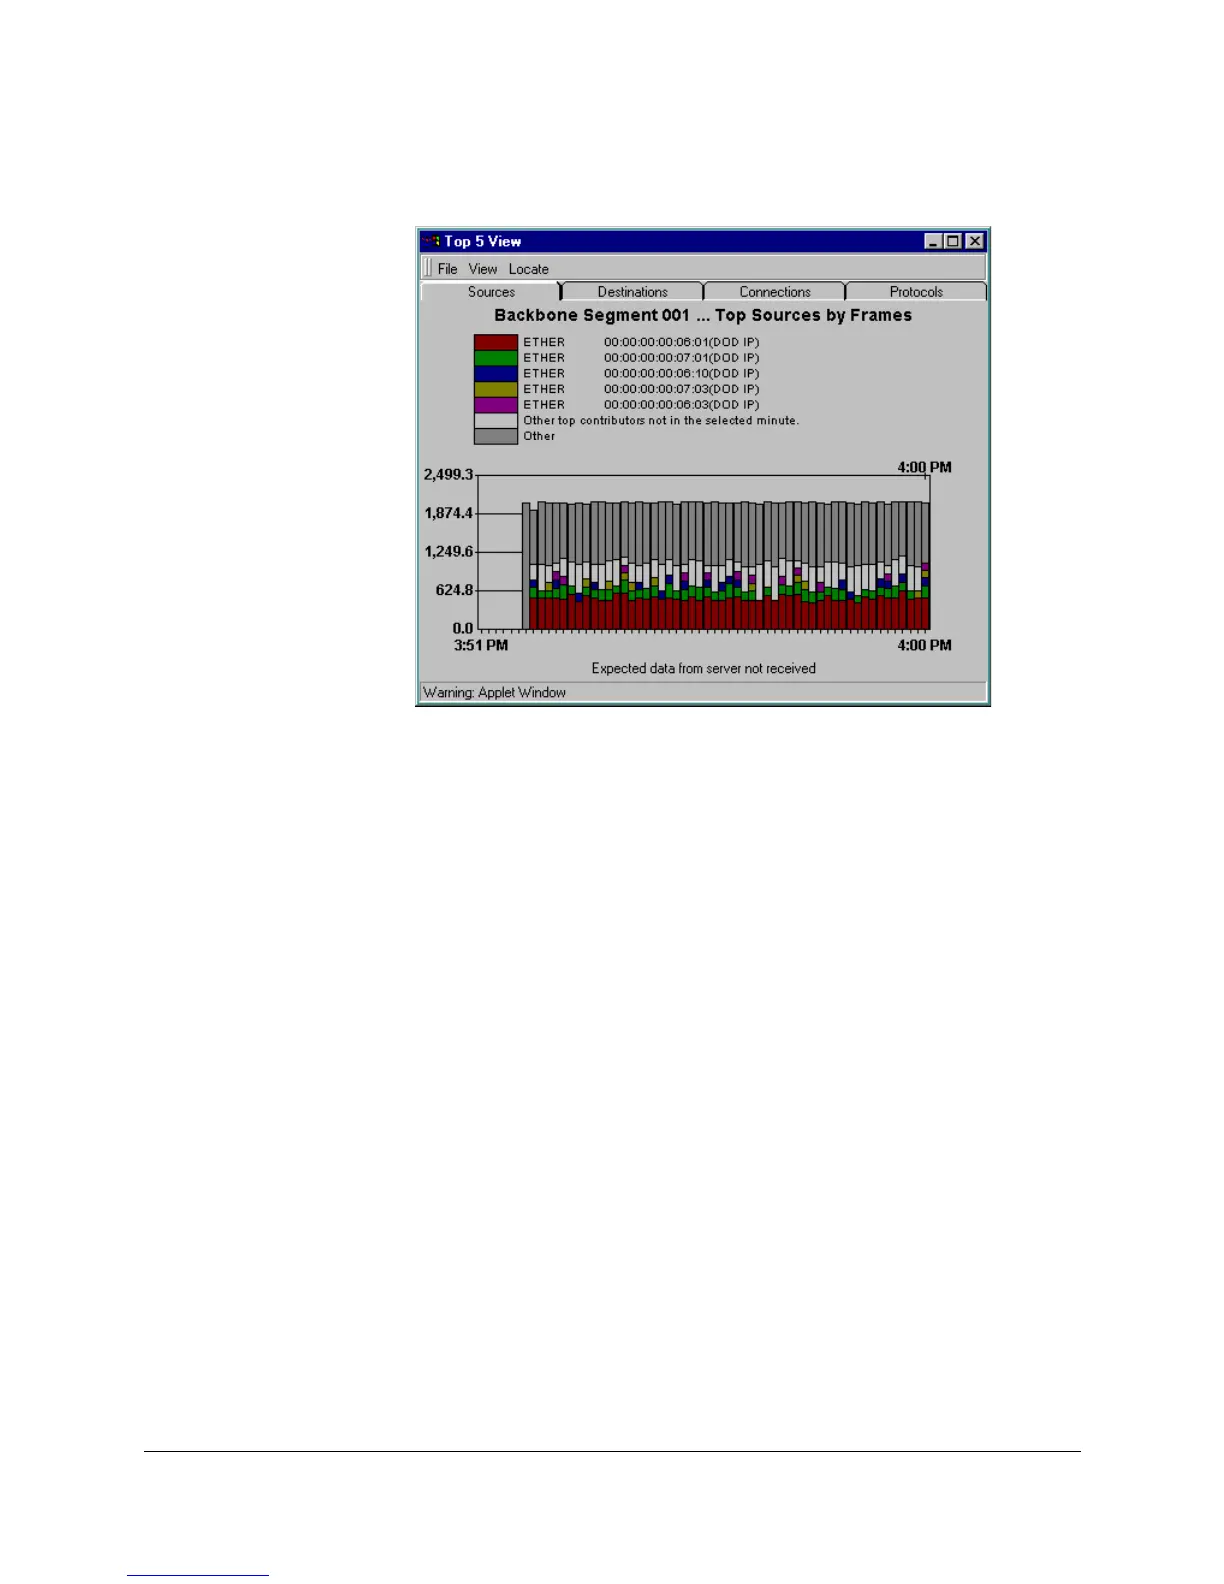
Who Are the Top 5 Talkers?
Figure 9-3. Top 5 Talkers
You can display graphs for each of the measured attributes showing:
■ Top Sources (default)
■ Top Destinations
■ Top Connections
■ Top Protocols
More than one graph can be displayed at a time, so you can look at the values
for multiple attributes for each segment.
Since Traffic Monitor presents real-time information, the data will be “moving”
on your graph. Data is graphed and updated every minute. The Top5 View
displays up to 60 data points, that is, you can view the most recent hour of
activity.
The right-most bar in the graph represents (up to) the top five nodes for the
latest minute graphed. This bar is selected by default and is indicated with a
black “tick” and the time sampled above it. The color-coded stacked bars
represent the activity for up to the top five nodes and “other” nodes for the
selected attribute and segment. The non-selected bars in the graph show how
these top talkers have behaved over the past hour. This lets you view trends
over the last hour for the five top talkers of the selected minute.
The yellow and the red horizontal lines on the background of the graph
represent the warning and critical values, respectively, for the selected
segment. These lines only appear when the graph scale is high enough.