The StellarMate Plus Manual
287 / 341
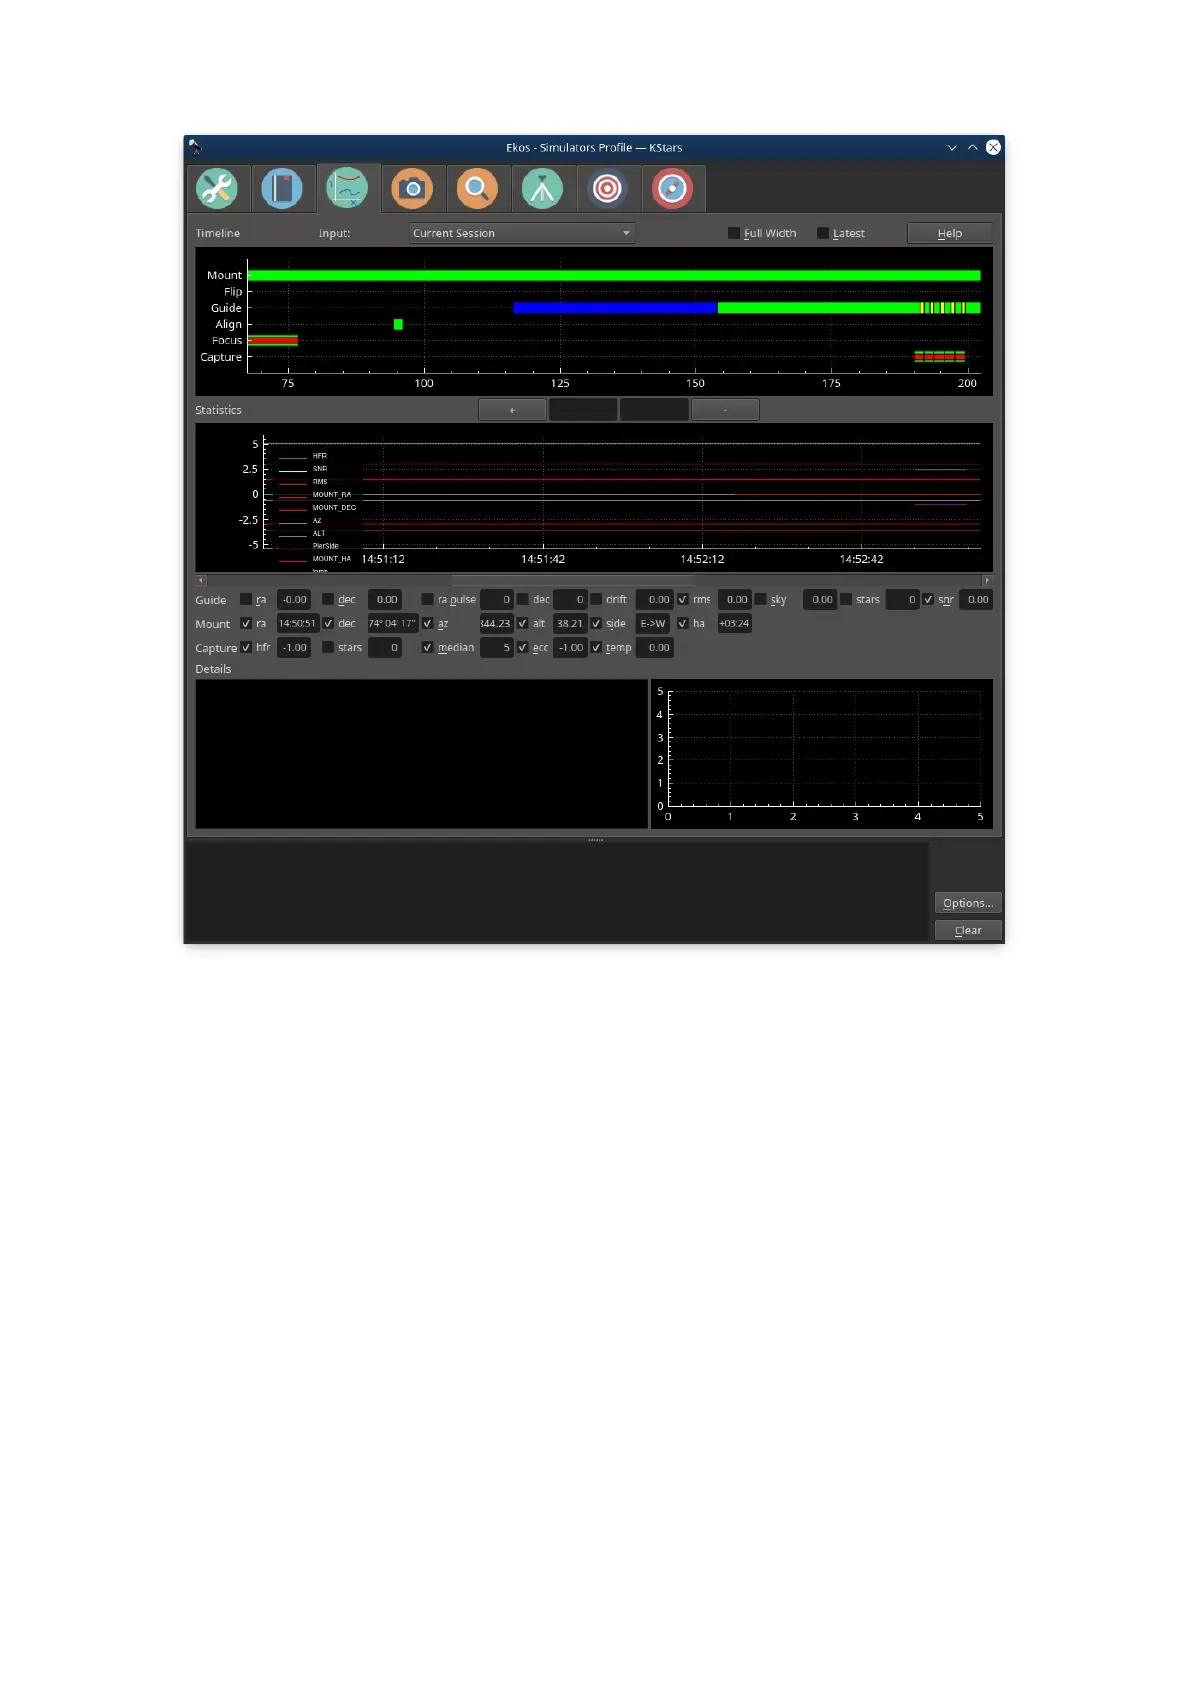
The Analyze Module records and displays what happened in an imaging session.
That is, it does not control any if your imaging, but rather reviews what occurred.
Sessions are stored in an analyze folder, a sister folder to the main logging
folder. The .analyze files written there can be loaded into the Analyze tab to be
viewed. Analyze also can display data from the current imaging session.
There are two main graphs, Timeline and Stats. They are
coordinated—they always display the same time interval from the Ekos
session, though the x-axis of the Timeline shows seconds elapsed from the start
of the log, and Stats shows clock time. The x-axis can be zoomed in and out with
the +/- button, mouse wheel, as well as with standard keyboard shortcuts (eg.
zoom-in == Ctrl +) The x-axis can be panned with the scroll bar as well as with
the left and right arrow keys. You can view your current imaging session, or
review old sessions by loading .analyze files using the Input dropdown. Checking
Full Width displays all the data, and Latest displays the most recent data (you
can control the width by zooming).
Timeline