Dual-Core Intel® Xeon® Processor 5100 Series Thermal/Mechanical Design Guide 21
Thermal/Mechanical Reference Design
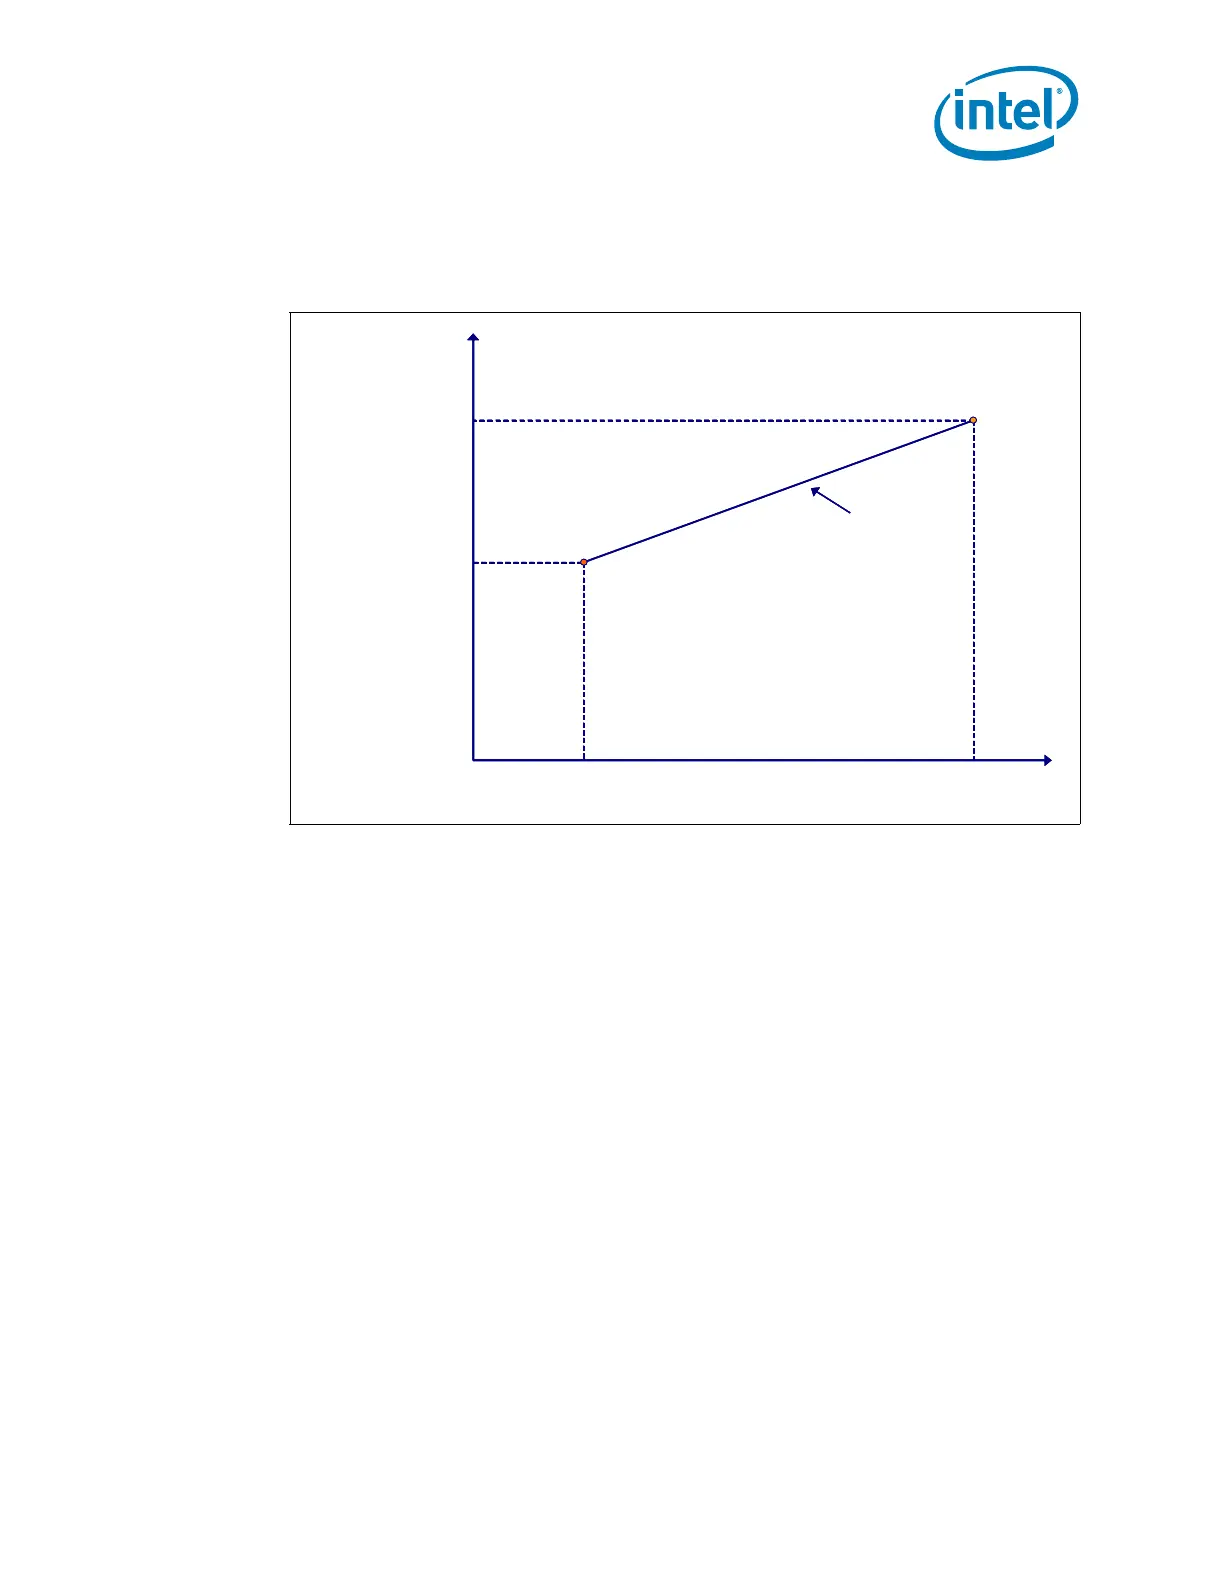
x =Processor power consumption (W)
a =Case-to-ambient thermal resistance, ψCA (°C/W)
b =Processor local ambient temperature, TLA (°C)
The higher end point of the Thermal Profile represents the processor’s TDP and the
associated maximum case temperature (T
CASE_MAX
). The lower end point of the
Thermal Profile represents the power value (P
_PROFILE_MIN
) and the associated case
temperature (T
CASE_MAX
@ P
_PROFILE_MIN
) for the lowest possible theoretical value of
T
CONTROL
(see Section 2.2.6). The slope of the Thermal Profile line represents the case-
to-ambient resistance of the thermal solution with the y-intercept being the local
processor ambient temperature. The slope of the Thermal Profile is constant between
P
_PROFILE_MIN
and TDP, which indicates that all frequencies of a processor defined by
the Thermal Profile will require the same heatsink case-to-ambient resistance.
In order to satisfy the Thermal Profile specification, a thermal solution must be at or
below the Thermal Profile line for the given processor when its DTS temperature is
greater than T
CONTROL
(refer to Section 2.2.6). The Thermal Profile allows the
customers to make a trade-off between the thermal solution case-to-ambient
resistance and the processor local ambient temperature that best suits their platform
implementation (refer to Section 2.3.3). There can be multiple combinations of thermal
solution case-to-ambient resistance and processor local ambient temperature that can
meet a given Thermal Profile. If the case-to-ambient resistance and the local ambient
temperature are known for a specific thermal solution, the Thermal Profile of that
solution can easily be plotted against the Thermal Profile specification. As explained
above, the case-to-ambient resistance represents the slope of the line and the
processor local ambient temperature represents the y-axis intercept. Hence the T
CASE
values of a specific solution can be calculated at the TDP and P
_PROFILE_MIN
power
levels. Once these points are determined, they can be joined by a line, which
represents the Thermal Profile of the specific solution. If that line stays at or below the
Thermal Profile specification, then that particular solution is deemed as a compliant
solution.
Figure 2-5. Thermal Profile Diagram
T
CASE
MAX
T
CASE
P
_PROFILE_MIN
T
CASE
MAX@
P
_PROFILE_MIN
Power
TDP
Thermal Profile
T
CASE
MAX
T
CASE
P
_PROFILE_MIN
T
CASE
MAX@
P
_PROFILE_MIN
Power
TDP
Thermal Profile