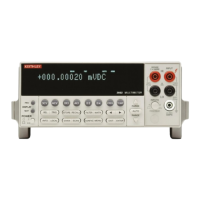
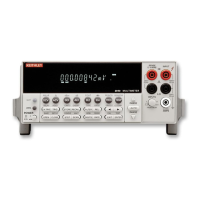
Bar Graph — The bar graph is a graphical represen-
tation of the reading with zero at the left end. Each full
segment of the bar represents approximately 4% of the
range limit.
2002 MULTIMETER
FILT 4W ARM
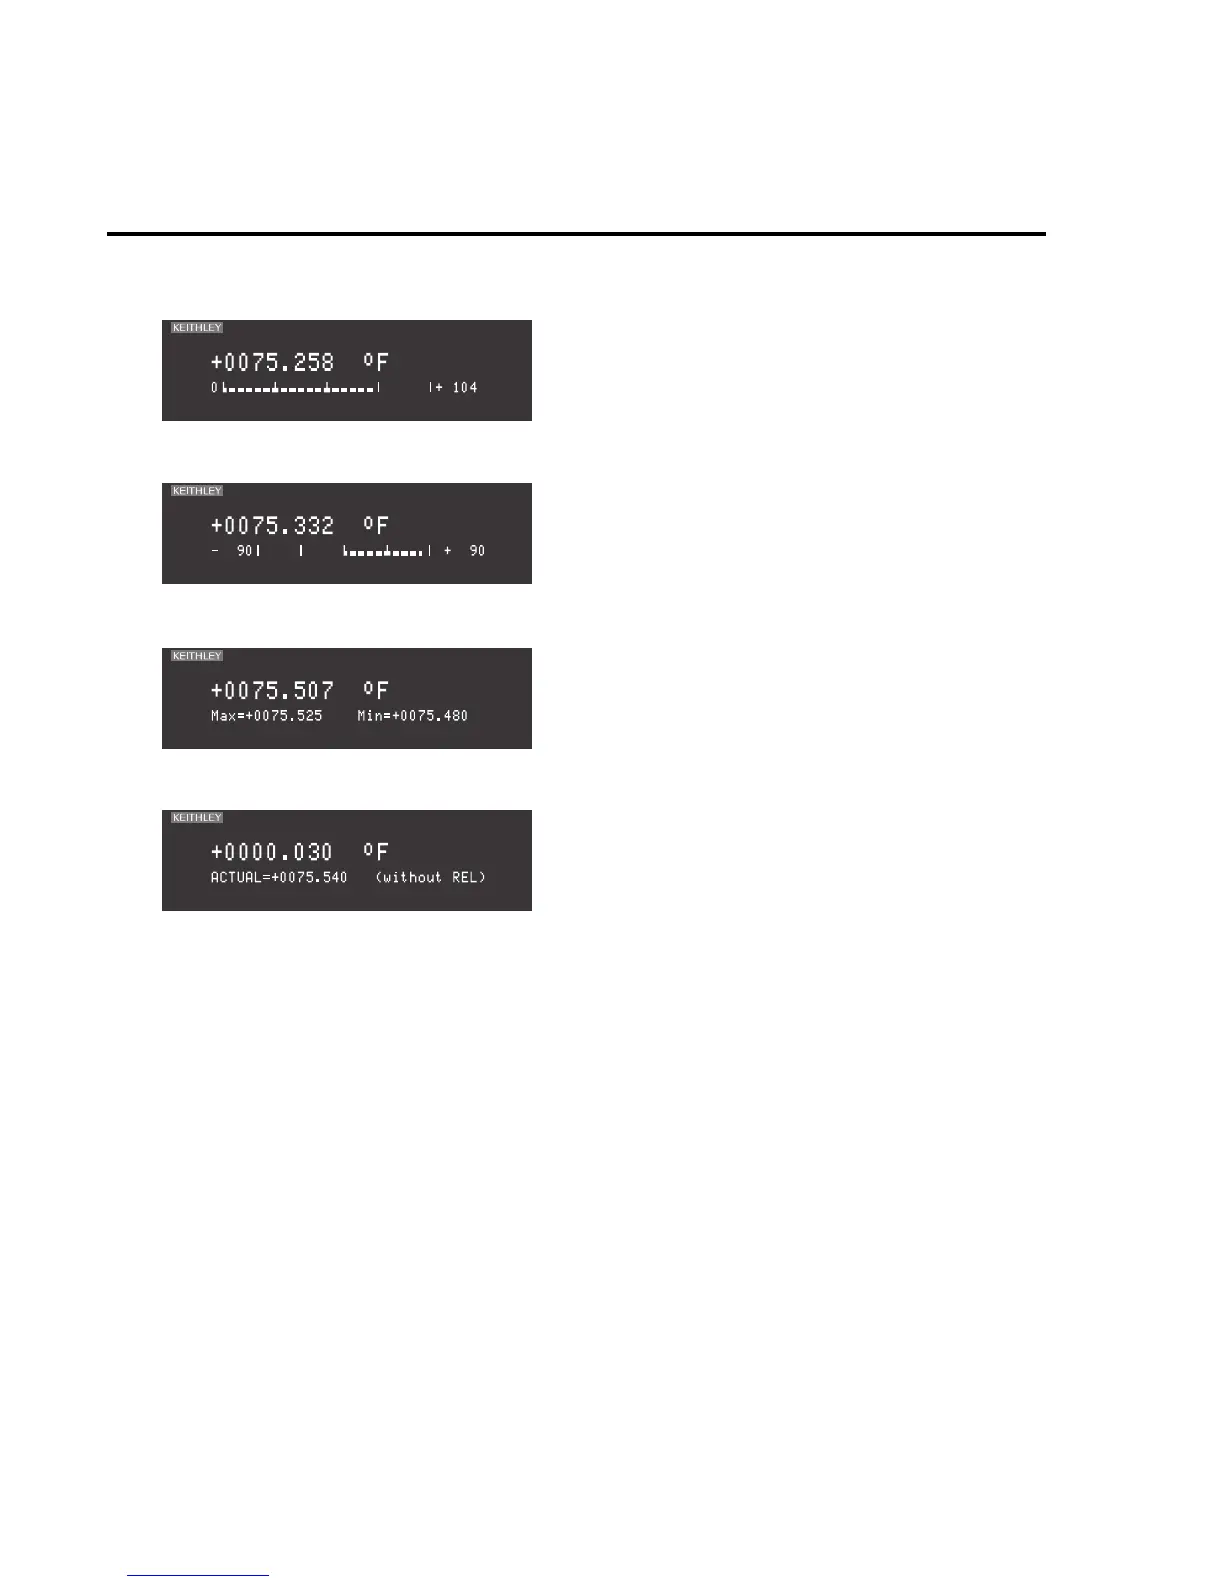
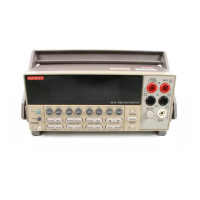
Zero-centered Bar Graph — The zero-centered bar
graph is a graphical representation of the reading using
plus minus limits with zero in the center. Each full seg-
ment represents 10% of the limit.
2002 MULTIMETER
FILT 4W ARM
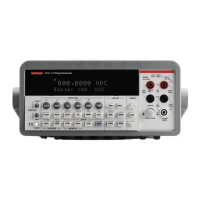
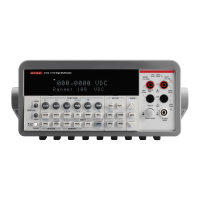
Maximum and Minimum — This display shows
the maximum and minimum readings that have oc-
curred since the display was entered. Maximum and
minimum values are reset by pressing the present func-
tion key or by leaving the display.
2002 MULTIMETER
FILT 4W ARM
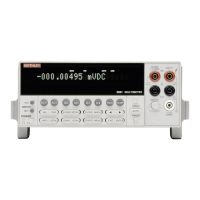
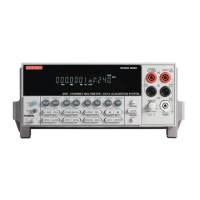
Relative and Actual — This display is used with
the rel (relative) feature. While the top line shows the
result of the rel operation, the bottom line shows the ac-
tual (raw) reading.
2002 MULTIMETER
FILT ARM
2-4 Measurement Options