133
Measuring Digital Communications Signals
Spurious Emissions Measurements
7 You may Focus the display
on a specific spurious
emissions signal.
a. Press Meas Setup, Spur, 1,
Enter (or enter the number of
the spur of interest)
b. Press Meas Type to highlight
Examine
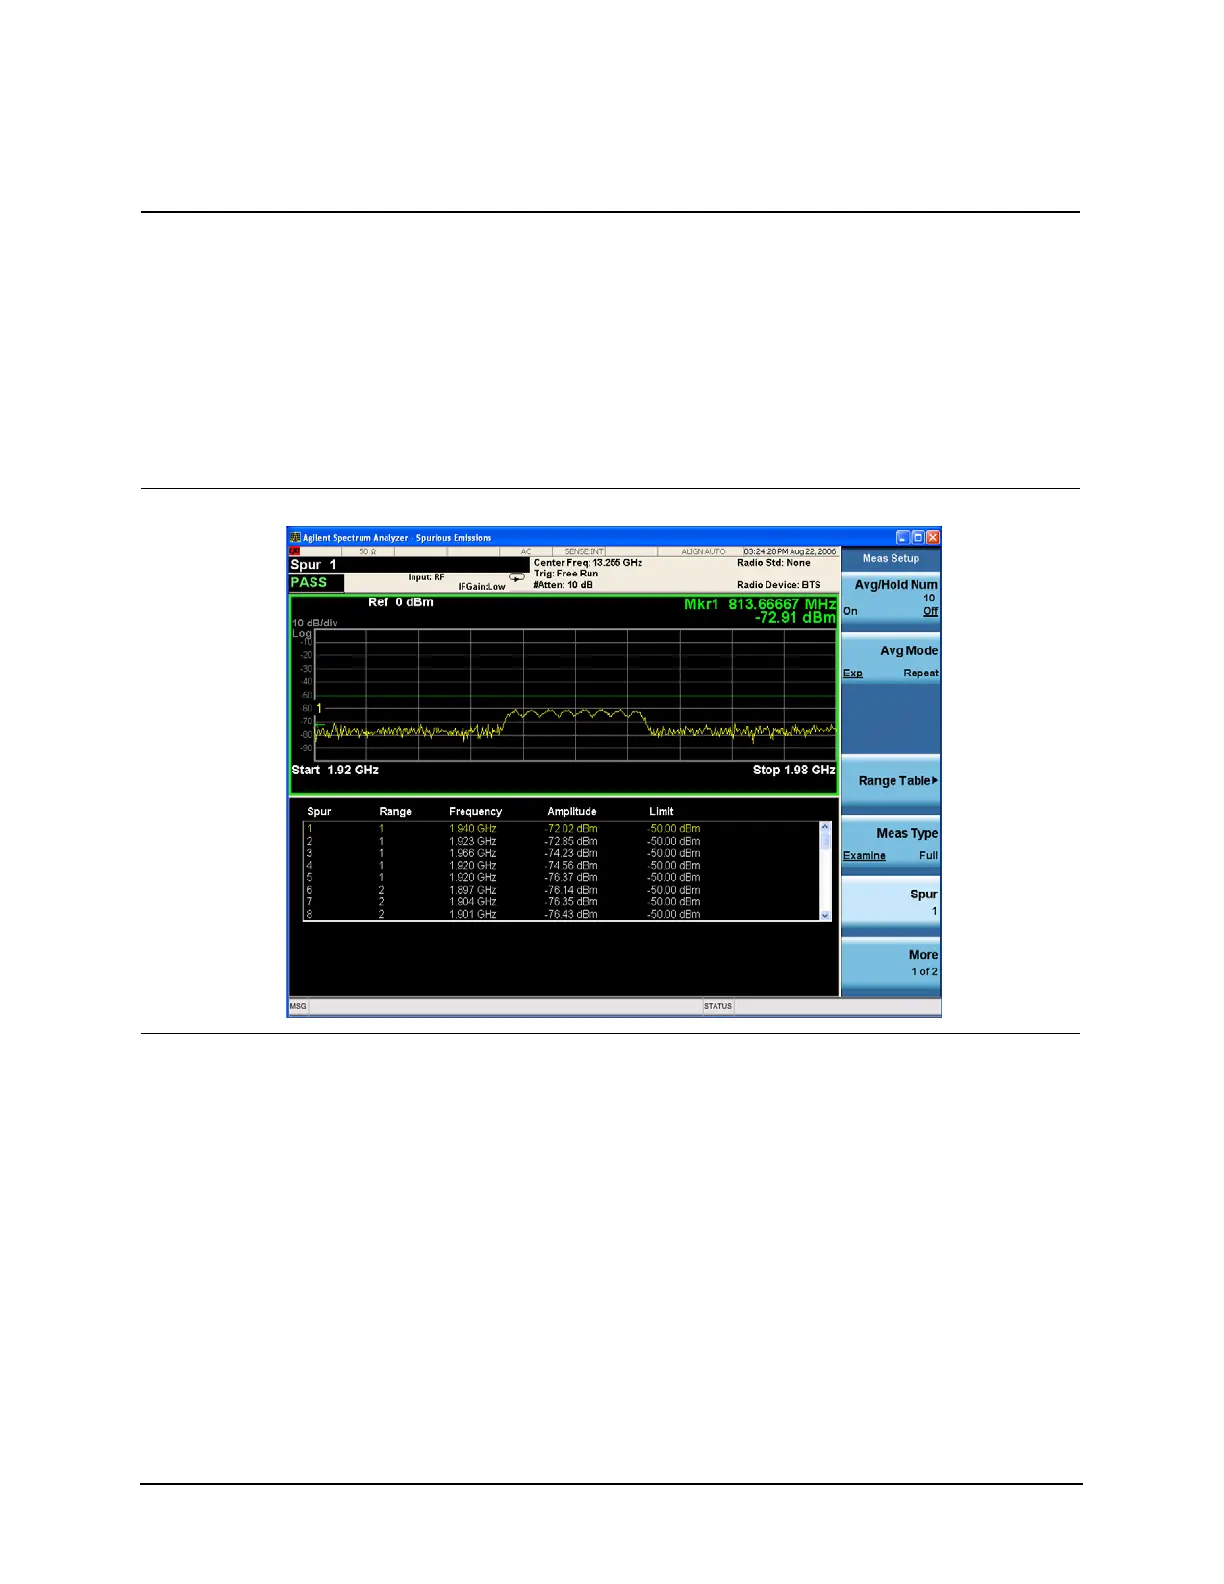
The Spurious Emission result should
look like Figure 9-15. The graph
window and a text window are
displayed. The text window shows the
list of detected spurs. Each line item
includes the spur number, the range in
which the spur was detected, the
power of the spur, and the limit value
against which the spur amplitude is
tested.
Figure 9-15 Spurious Emission Measurement Result
8 You may customize the
tested ranges for spurious
emissions (initially 5
default ranges and
parameters are loaded into
the range table).
• Press Meas Setup, Range
Table, then select and edit
the available parameters.
Step Action Notes

 Loading...


