65
Making Distortion Measurements
Identifying Analyzer Generated Distortion
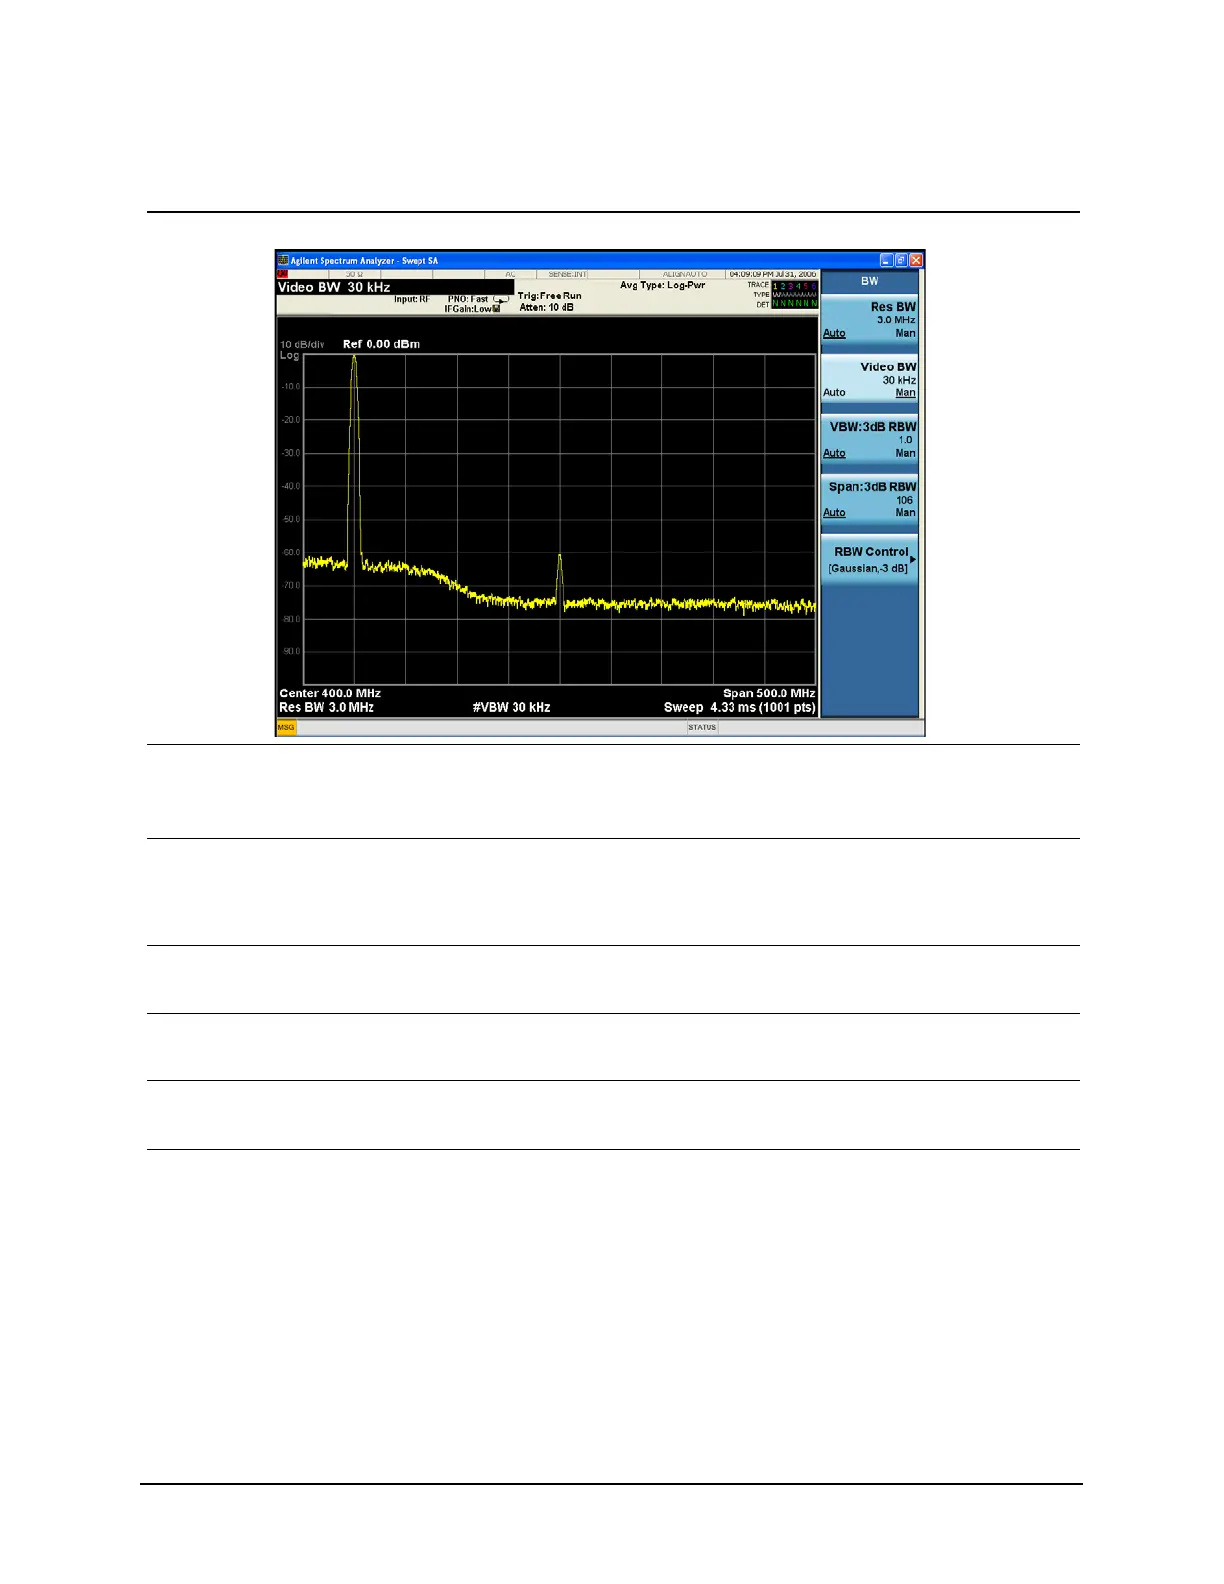
Figure 6-1 Harmonic Distortion
5 Change the center
frequency to the value
of the second harmonic.
• Press Peak Search, Next Peak,
Mkr→CF.
6 Change the span to
50 MHz and re-center
the signal.
a. Press SPAN X Scale, Span, 50,
MHz.
b. Press Peak Search, Mkr→CF.
7 Set the attenuation to
0 dB.
• Press AMPTD Y Scale,
Attenuation, 0, dB.
8 Save the trace data in
trace 2.
• Press Trace/Detector, Select
Trace, Trace 2, Clear Write.
9 Allow trace 2 to update. • Press Trace/Detector,
View/Blank, View, Trace On.
Minimum of two sweeps.
10Place a delta marker on
the harmonic of trace 2.
• Press Peak Search, Marker Delta. The analyzer display shows the
stored data in trace 2 and the
measured data in trace 1. The
ΔMkr1 amplitude reading is the
difference in amplitude between
the reference and active markers.
Step Action Notes

 Loading...


