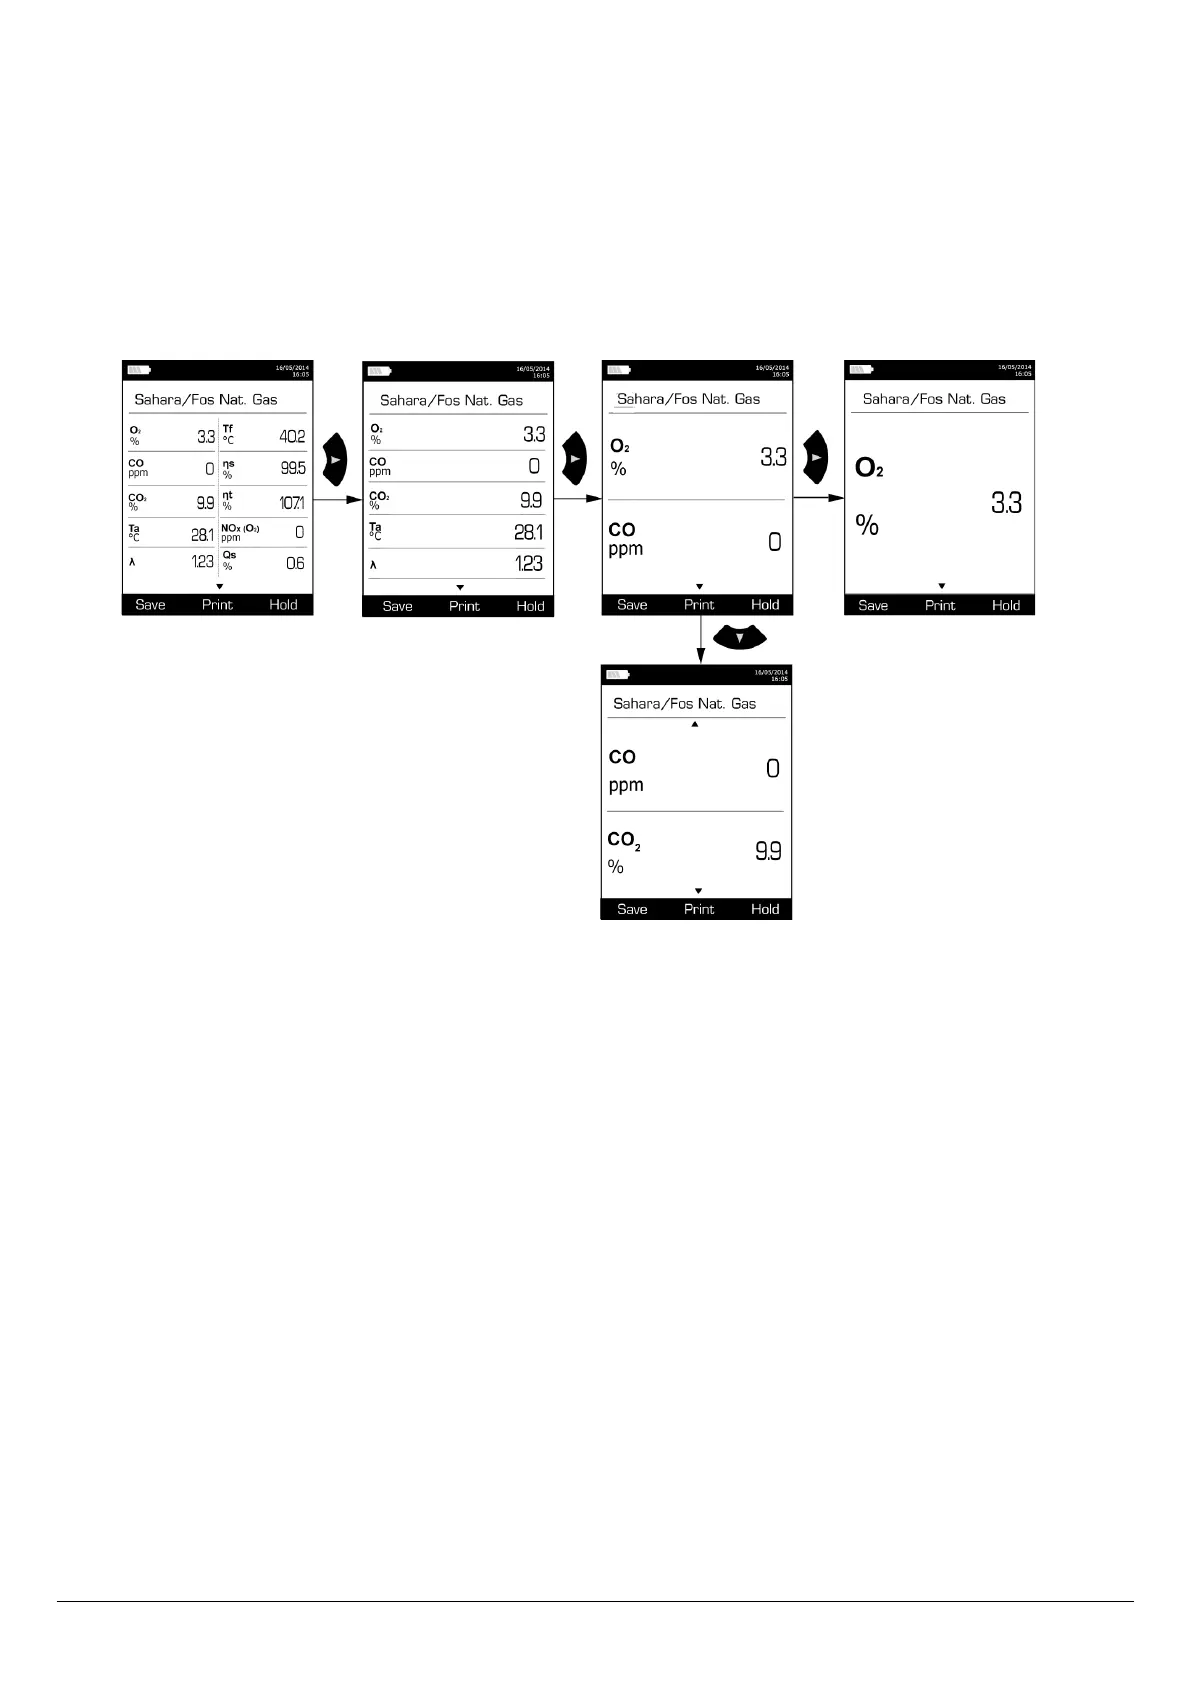
3.3. Zoom function
From the gas analysis screen, the zoom function is available using the direction arrows.
The initial screen displays 12 measured values.
➢ To zoom in, press the right arrow.
The screen displays 6 measured values.
➢ To zoom in again, press the right arrow.
The screen displays 3 measured values.
➢ To zoom in again, press the right arrow.
The screen displays one measured value.
➢ To zoom out, press the left arrow.
➢ At any time, press the down arrow to scroll the values.
3.4. Assign the analysis to a customer
➢ At the end of the analysis, when measurements are constant, it is possible to assign it to a customer recorded in the analyser
or to unrecorded customer that should be created.
➢ Press the “Save” function button.
The analyser displays the list of recorded customers.
➢ Select a customer with up and down arrows then press OK or create a customer (see page 23) then select it.
The analyser displays the list of available boilers.
➢ Select the boiler with up and down arrows then press OK or create a boiler (see page 24) then select it.
The analyser backs to the measurement screen of the analysis.
3.5. Add the measurement to a group
The groups allow to regroup measurements in folders. The group function has to be activated (see page 18).
Once the measurement is linked to a customer and a boiler, it is possible to add it in a group in the instrument, or create a group:
The analyser proposes to add the measurement to a group.
➢ Go to YES and press OK.
➢ Go to the required group with the arrows and press OK, or create a group (see page 25).
The analyser backs to the measurement screen.
3.6. Print the analysis results
It is possible to print the results on the ticket:
➢ Press the “Print” function button.
Results are printed on the ticket.
See page 17 for the printing configuration.
Perform a flue gas analysis 15