6. Application Example
57
Standard Curve
In the control bar click Standard curve from the Concentrations item to define
the appropriate standard curve.
The following is in the test kit description:
After the blank correction, the optical densities (OD 492 - OD 620) are plotted
versus the concentration. The regression line that goes through these points is
the standard curve.
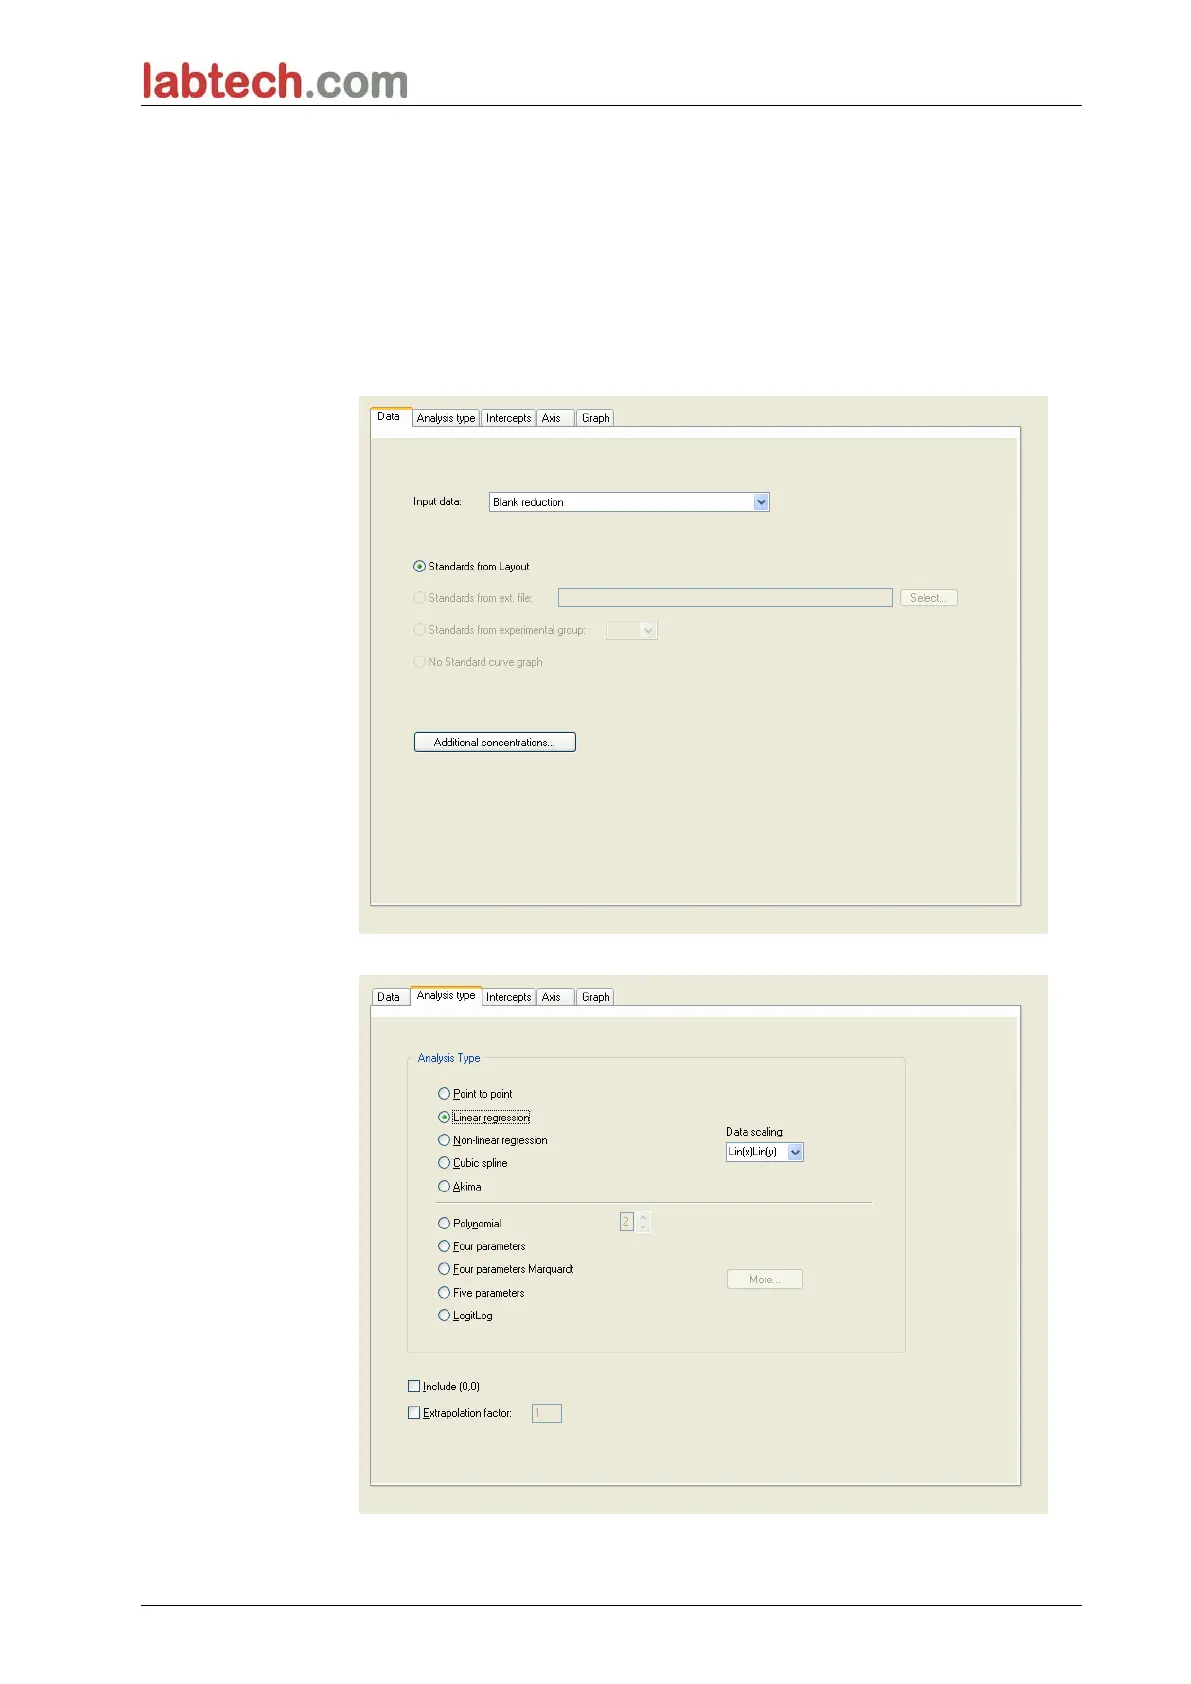
On the Data tab, select Blank reduction as input data.
On the Analysis type tab, select Linear regression.