256 WM-OM-E Rev I
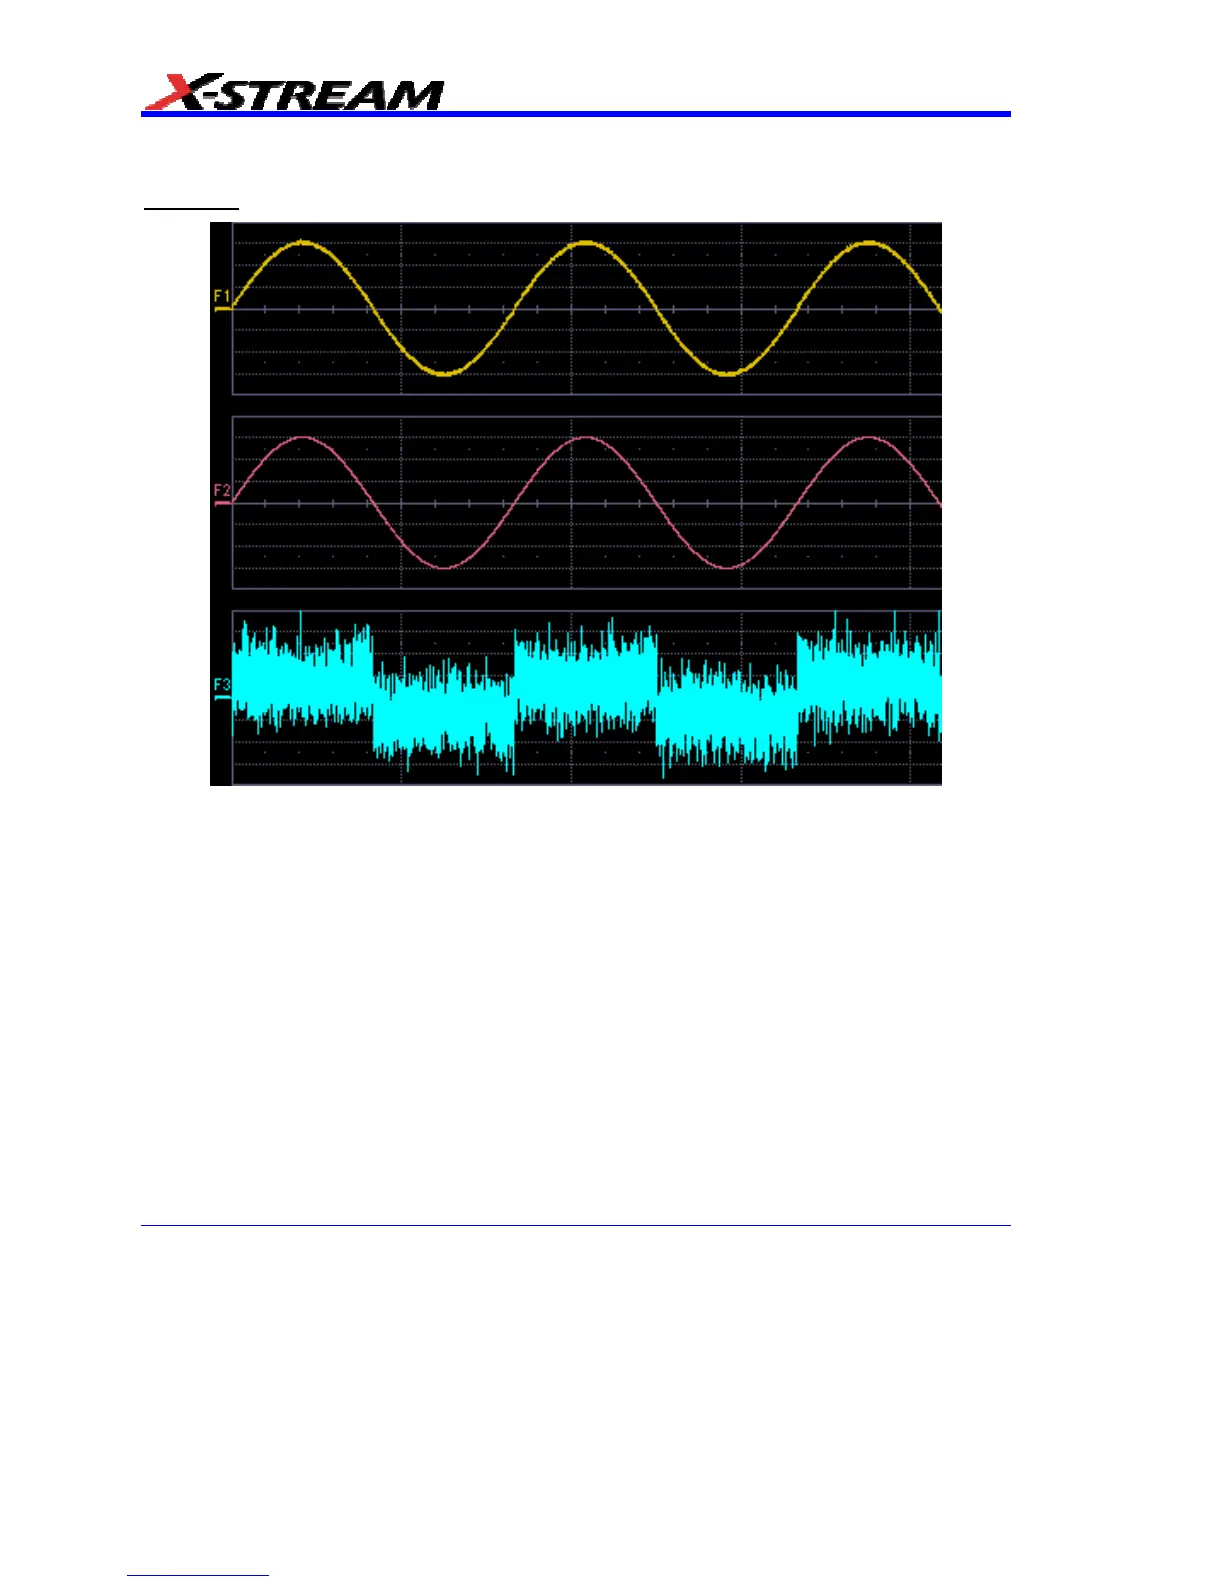
golden waveform. The subtraction (of course) contains all the noise, but it also shows the presence
of a very small square wave signal.
Example 3
Here is the VBScript that produced the "golden sine" (F2 above):
Frequency = 3000000.0 ' Frequency of real data
SampleTime = InResult.HorizontalPerStep
Omega = 2.0 * 3.1416 * Frequency * SampleTime
Amplitude = 0.15 ' Amplitude of real data
For K = 0 To LastPoint
newDataArray(K) = Amplitude * Sin(Omega * K)
Next
OutResult.DataArray(True) = newDataArray ' Data in volts
OutResult.DataArray is the waveform returned to the scope and displayed on the scope as the F2
waveform.