X-Stream Operator’s Manual
WM-OM-E Rev I 335
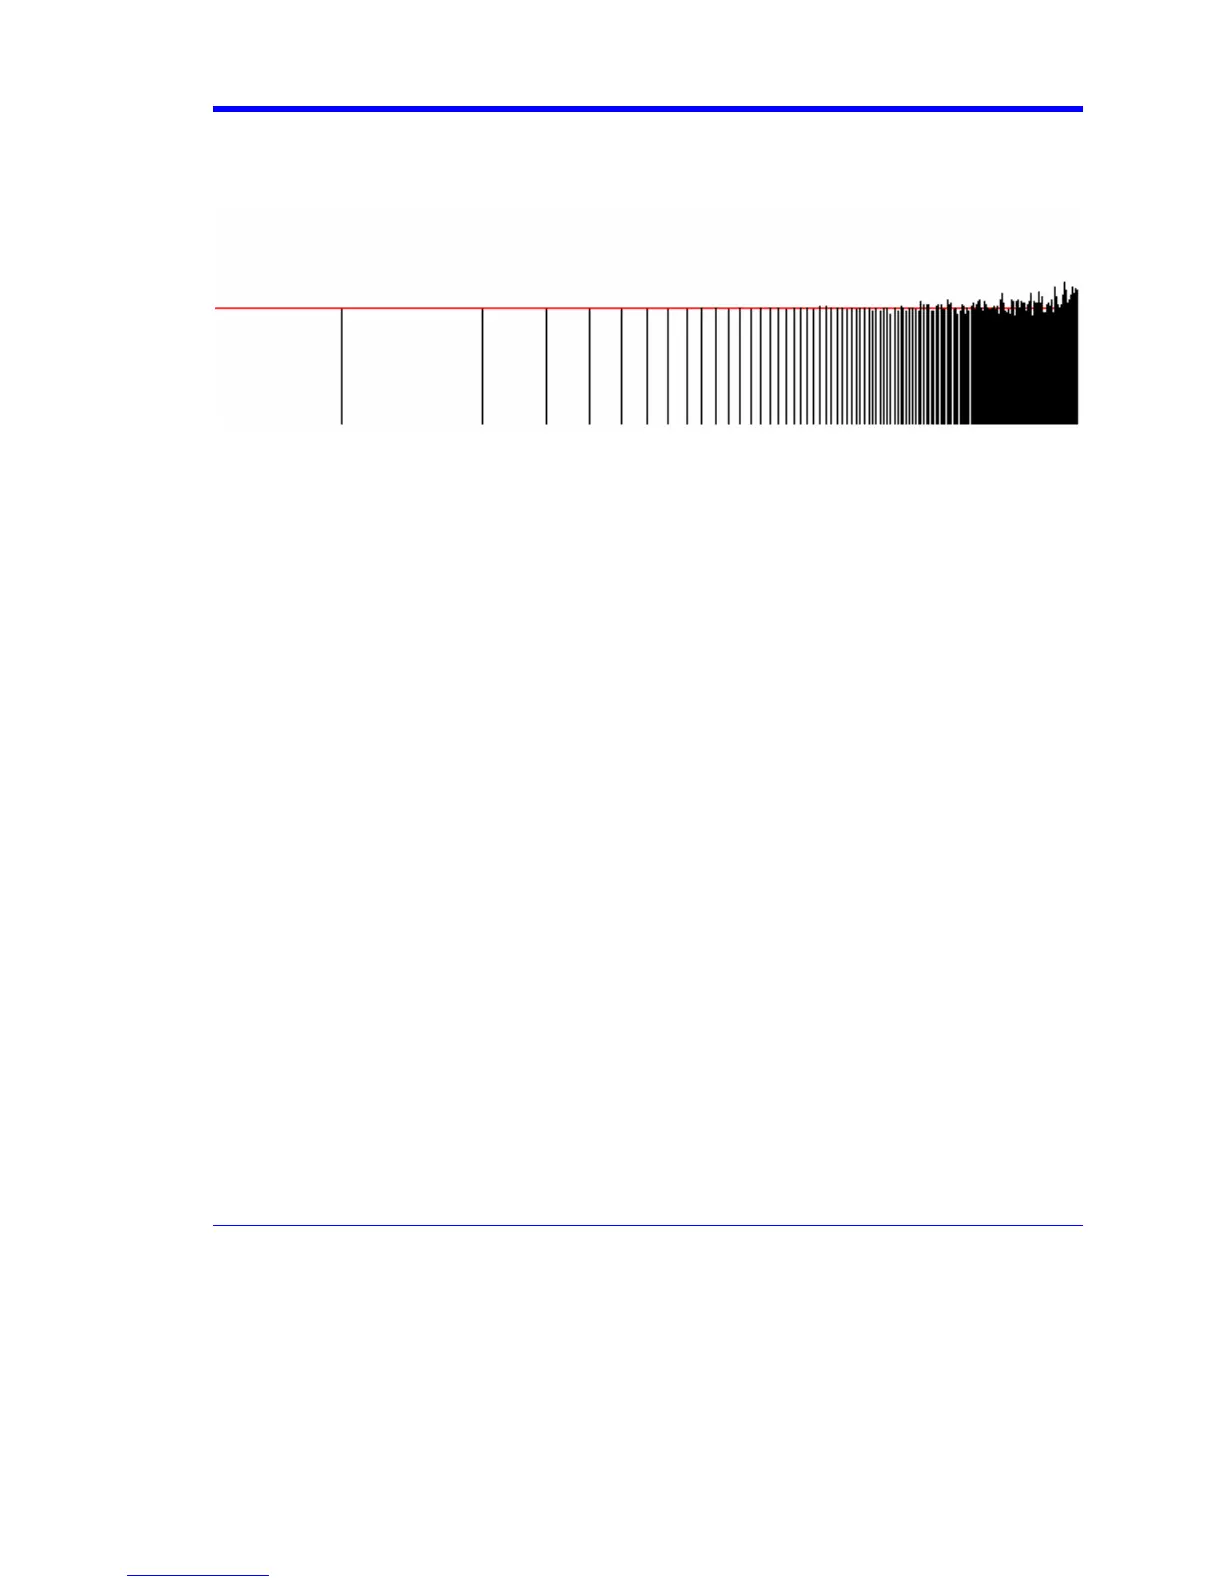
curve, the result for a perfect DUT would be a horizontal line, which is easy to inspect. The example
below has been magnified vertically by a factor of ten. The rise at the right side occurs because the
signal is descending into the noise.
Private Sub Command1_Click()
' Draw a DSO trace on a logarithmic horizontal scale.
Dim WM As Object
Set WM = CreateObject("LeCroy.XStreamApplication")
Dim Samples As Long
Samples = WM.Math.F1.Out.Result.Samples
Samples = Samples - 1 ' Make it a round number.
' Calculate the horizontal scale.
LogSamples = Log(Samples)
XScale = Samples / LogSamples
' Set the scale using DSO variables
Dim Top, Bot As Single
Top = WM.Math.F1.Out.Result.VerticalFrameStop
Bot = WM.Math.F1.Out.Result.VerticalFrameStart
Picture1.Scale (0, Top)-(Samples, Bot)
Dim Wave
Wave = WM.Math.F1.Out.Result.DataArray
Dim Black, White, Blue, Red As Long
Black = 0: White = &HFFFFFF
Blue = &HFF4444: Red = &HFF
' Draw a theoretical curve for the peaks.
StartPoint = Top + 20#: EndPoint = -54.5
Picture1.Line (0, StartPoint)-(Samples, EndPoint), Red
' Draw the plot with linear interpolation between points.
For X = 1 To Samples
LogX = XScale * Log(X): Y = Wave(X)
If X > 1 Then
Picture1.Line (LogX, Y)-(OldLogX, OldWave), Black