Overview Chapter 2
Mastersizer 2000 Page 2-3
ill 4856
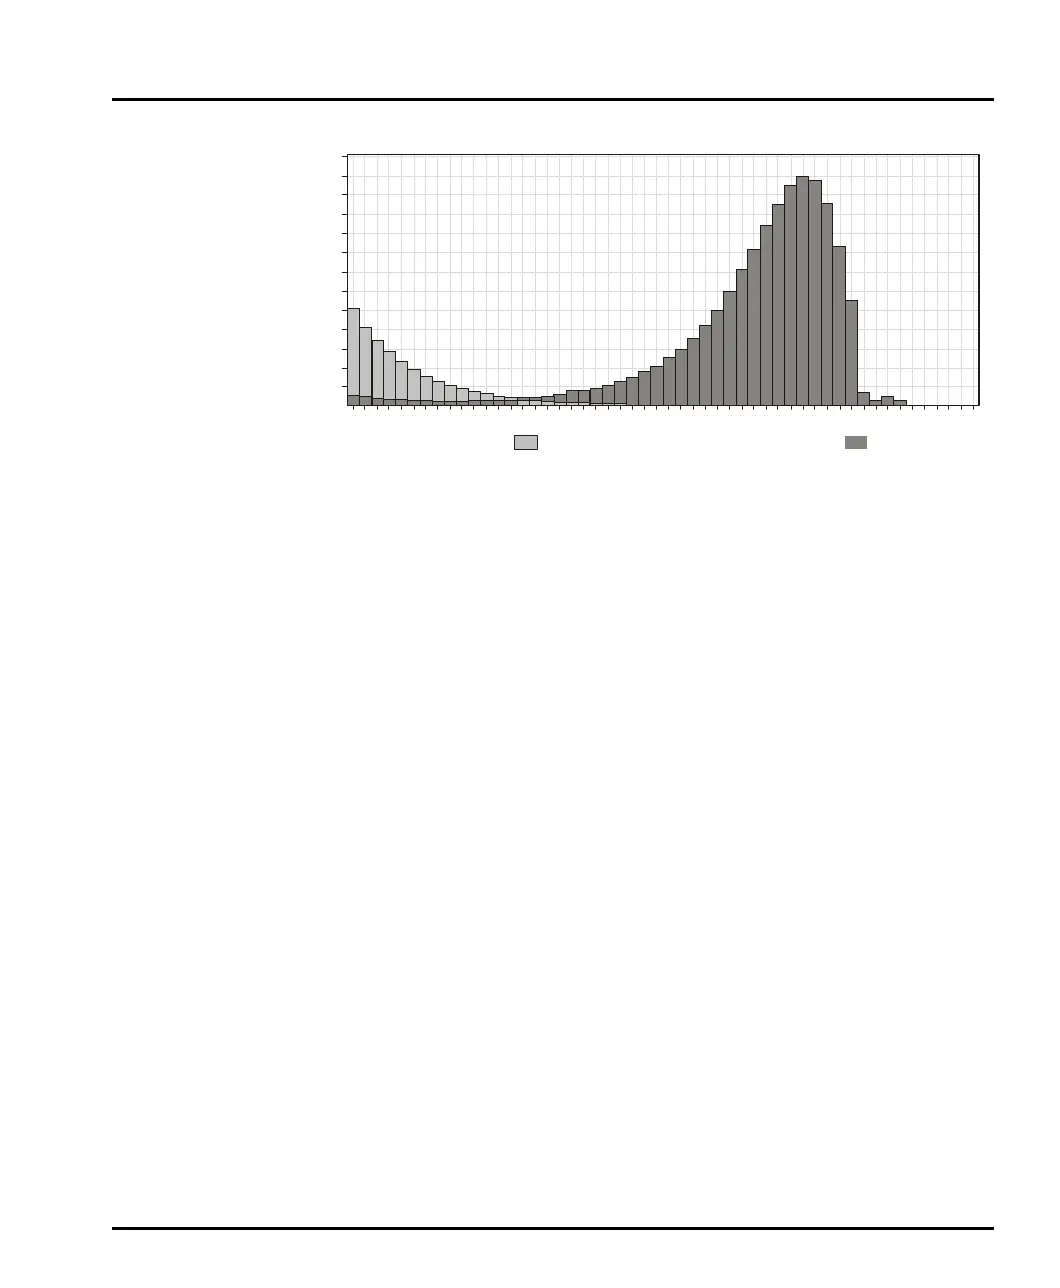
Each bar in the histogram represents the light scattering from one of the detec-
tor elements (known as a channel).
The detector array takes a “snapshot” of the scattering pattern. Obviously this
snapshot only captures the scattering pattern from the particles that are passing
through the analyser beam at that particular time. Taking only one snapshot
may not give a representative reading of the scattering pattern. To overcome
this, the Mastersizer takes many snapshots (known as snaps) and averages the
result. Typically over 2000 snaps are made for each measurement, with each
snap taking 1ms.
3. Once the measurement is complete, the raw data from it is analysed by the
Malvern software using one of the theories mentioned above. Once the data
has been analysed the information can be displayed in various ways.
Note the following points regarding the measured data and the analysis:
Analysing the measurement data does not permanently alter the data. The
measurement data can be re-analysed using different methods over and over
again.
The software makes a measurement and then analyses the data automatically.
Background data
5
130
120
110
100
90
80
70
60
50
40
30
20
10
0
504540353025201510
wet measure, 21/06/98 9:18:18 am
Data Graph - Light Scattering
MAN0384-1.0 Mastersizer 2000.book Page 3 Tuesday, March 20, 2007 8:56 AM