Overview Chapter 2
Mastersizer 2000 Page 2-5
Viewing the results
Once the measurement information has been gathered and analysed, it can be dis-
played in many forms. The Malvern software is supplied with many standard
“reports” that each display the information in a specific way. For each report that is
displayed on the screen, there is an equivalent “hard copy” report for printing the
report information to a printer.
Remember that the different reports show the same data in different ways.
All data from a measurement and analysis is stored in a “record”. Records are stored
in a measurement file. A measurement file can contain one or more records (see
Chapter 7 for details on handling measurement files).
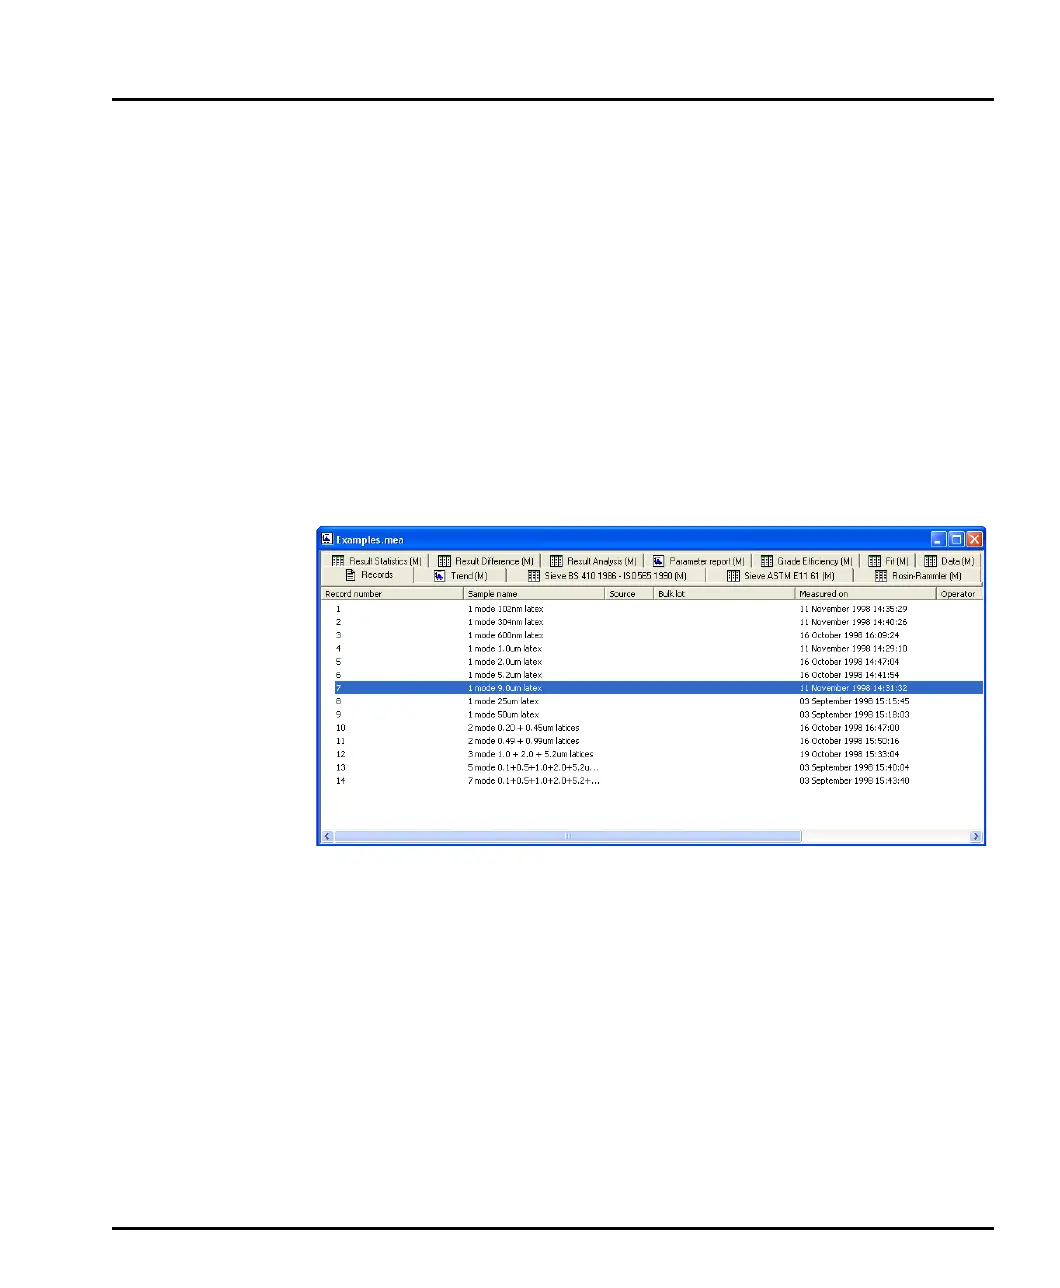
Before measurement data can be viewed a measurement file must be opened (by
selecting File-open and selecting a record). A typical measurement file is shown
below:
The Records tab is shown initially. Selecting this tab shows all the records within
the opened measurement file. One or more records must be selected before a
report can be opened. The series of tabs at the top of the window shows the reports
that are available. To change between reports simply select another report tab.
If the standard reports do not satisfy the user’s specific requirements, custom
reports can be built using the Report Designer application. See Chapter 5 for
details on using the Report Designer.
It is possible to zoom into a graph report. Simply hold down the left button, then
slowly move the mouse to draw a “marquee” (from top left to bottom right) around
the area to be enlarged. To zoom back out, simply left mouse click on the graph.
Details on interpreting the reports and an explanation of the standard reports are
given in Chapters 5 and 6.
MAN0384-1.0 Mastersizer 2000.book Page 5 Tuesday, March 20, 2007 8:56 AM