Chapter 5 Viewing the results
Page 5-6 MAN 0384
Changing views - the Report Designer
Using the Report Designer, custom reports can be designed by the user. These
provide a standardised output for the result of a selected measurement record
which can be tailored to the user’s needs.
Two views must be edited due to the different aspect ratios of the printed page and
the computer screen. The Page Layout shows the printed version and the Screen
Layout shows the screen display. This allows addition of picture objects such as
company logos to printed reports while not showing them on the screen display.
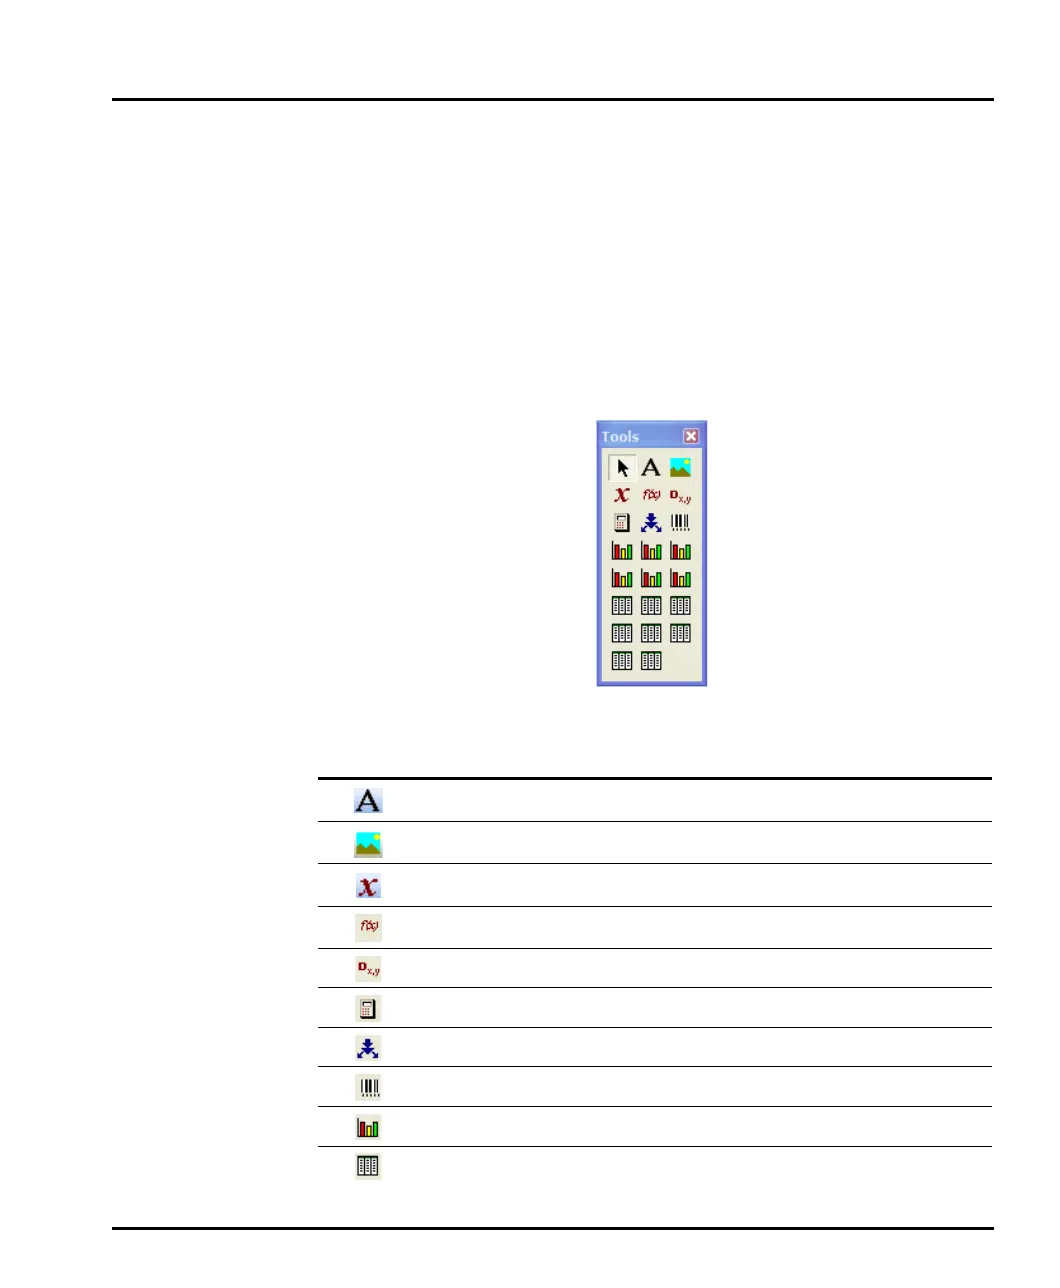
To add items to a report, use this Tools box or Control Palette:
Use the following buttons on the palette to add the listed elements to a report:
Button Use this to add:
Text.
Picture – bitmaps, GIFs, JPEGs, metafiles and icons.
Parameter (any parameter used by the Mastersizer system).
Conditional expression – can be used to make pass/fail decisions.
Calculated quality parameter.
Custom calculation.
Grade efficiency parameter.
Sample pot barcode.
Graph – several types are available, as described below.
Table – several types are available, as described below.
MAN0384-1.0 Mastersizer 2000.book Page 6 Tuesday, March 20, 2007 8:56 AM