Chapter 5 Viewing the results
Page 5-2 MAN 0384
5
Displaying the information
Open a measurement file by selecting File-Open. Once a file has been selected, a
Measurement window will appear.
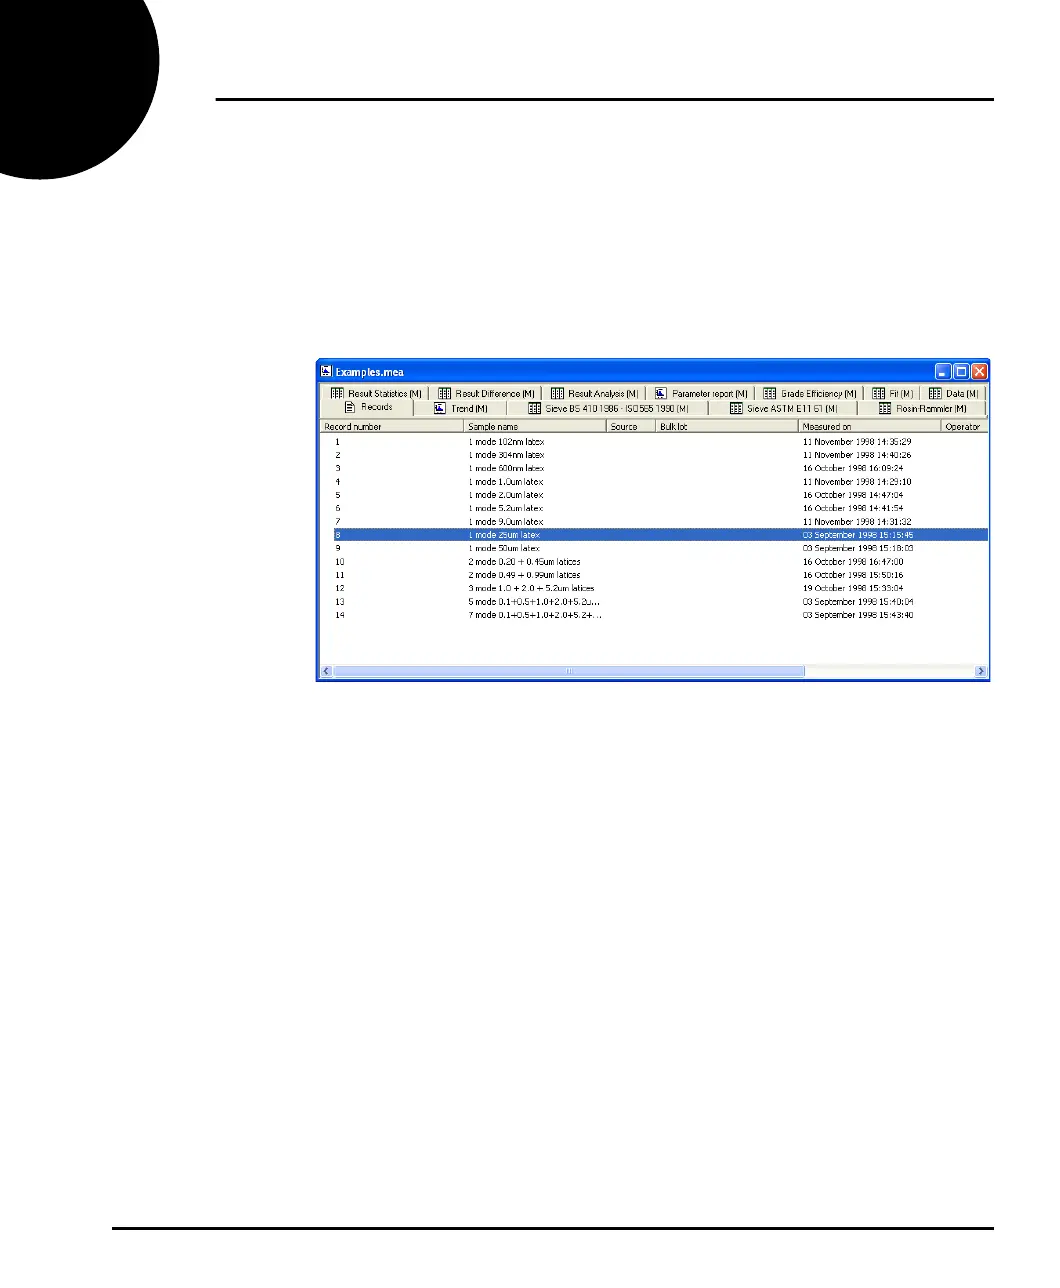
A typical Measurement window is shown below. The information displayed for a
measurement is controlled by the tabs. The first tab is always Records. This lists all
the measurement records (individual measurements) that are held in that measure-
ment file. The user must select a record before it can be displayed.
To view the record’s data in a report, select the record then select a report tab.
Some reports allow the user to compare or display more than one record. For
example, if the user selects more than one record in the Records tab and then
selects the Sample data report tab, a graph will show the sample data for all
selected records over-plotted on a single graph.
The format of the information in a report can often be changed by selecting an item
and right-clicking the mouse. For example, selecting the table in a Result Analysis
report and right-clicking lets the user change the report to a “Result-in %”, “Result-
over %” or “Result-under %”, format (see Chapter 6 for details of the reports).
Changes to the graph and table format will be reflected in any printouts of the
selected report.
MAN0384-1.0 Mastersizer 2000.book Page 2 Tuesday, March 20, 2007 8:56 AM