152 CONTENTS
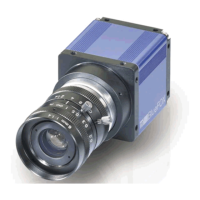
Figure 1: Color chart as a starting point
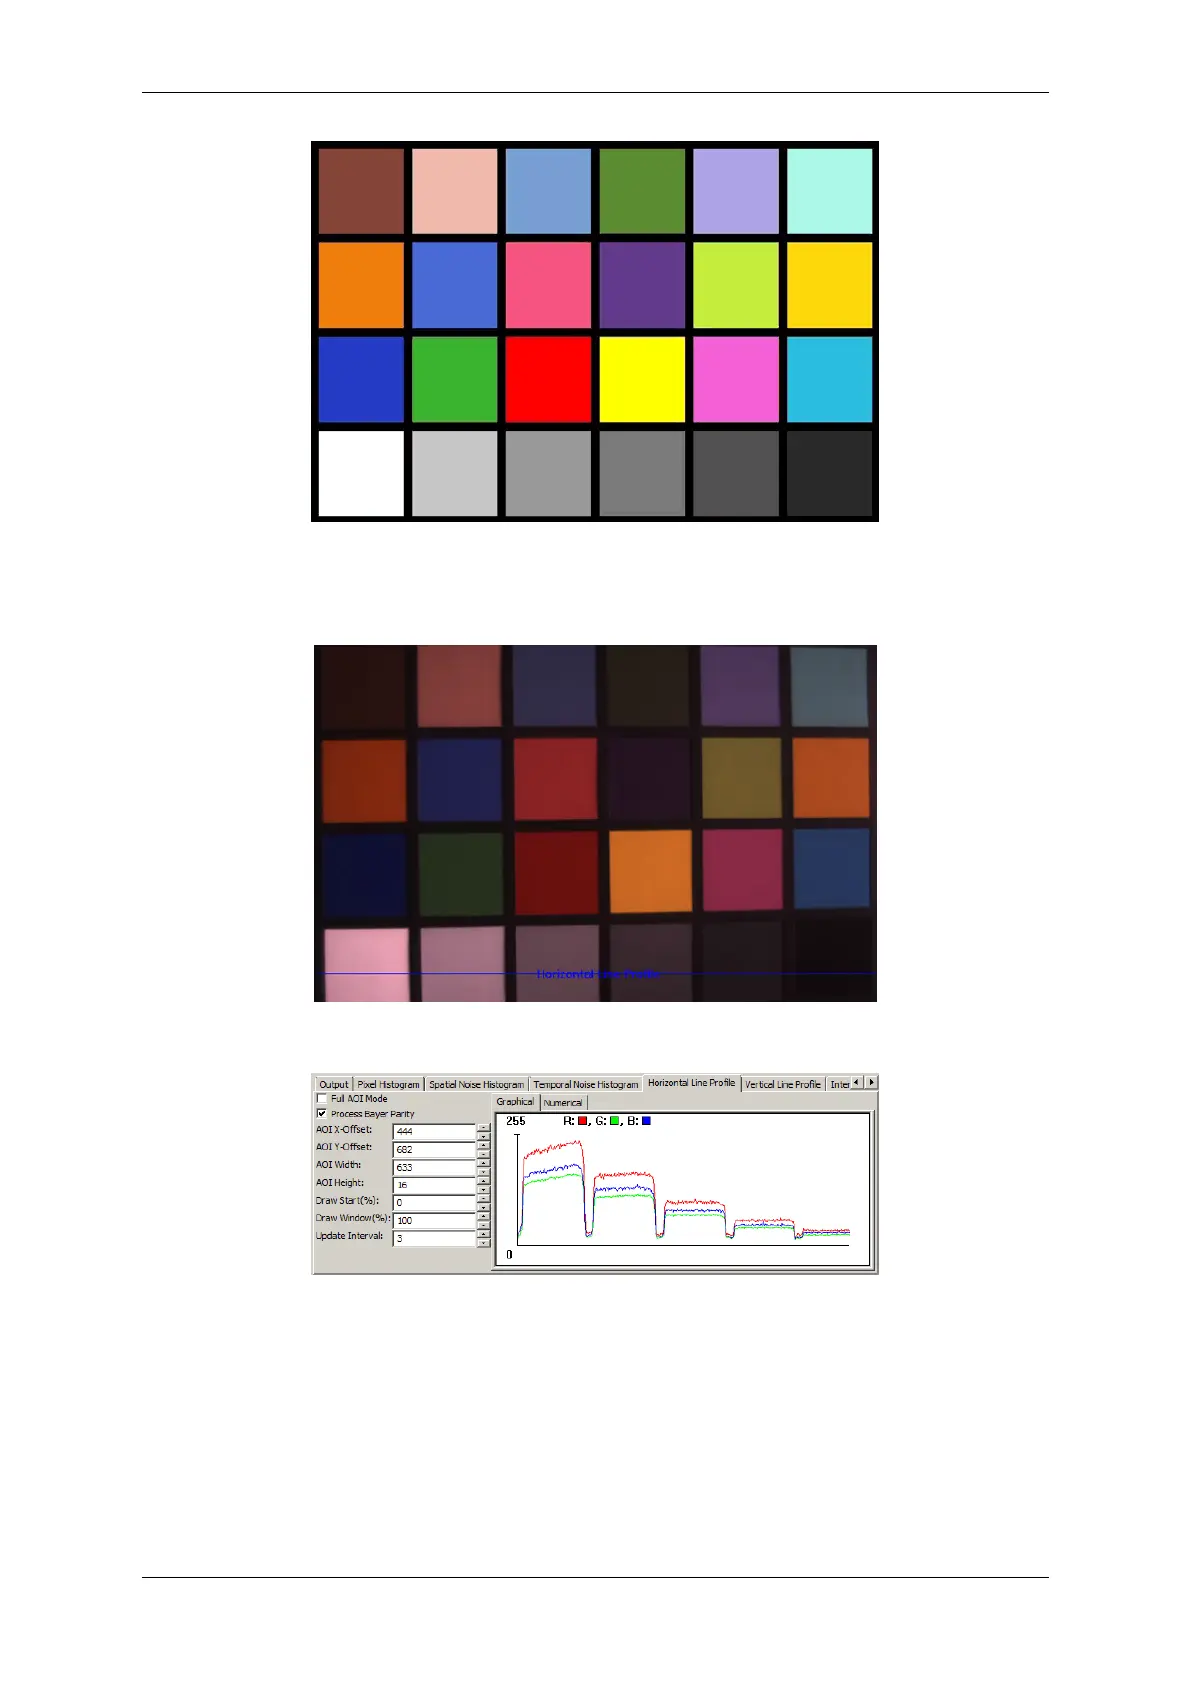
If we take a SingleFrame image without any color optimizations, an image can be like this:
Figure 2: SingleFrame snap without color optimization
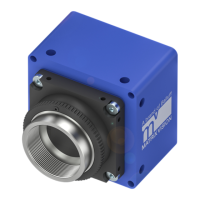
Figure 3: Corresponding histogram of the horizontal white to black profile
As you can see,
• saturation is missing,
• white is more light gray,
• black is more dark gray,
• etc.
MATRIX VISION GmbH