196
Fig. 6-59 Schematic diagram description of adjusting the S curve
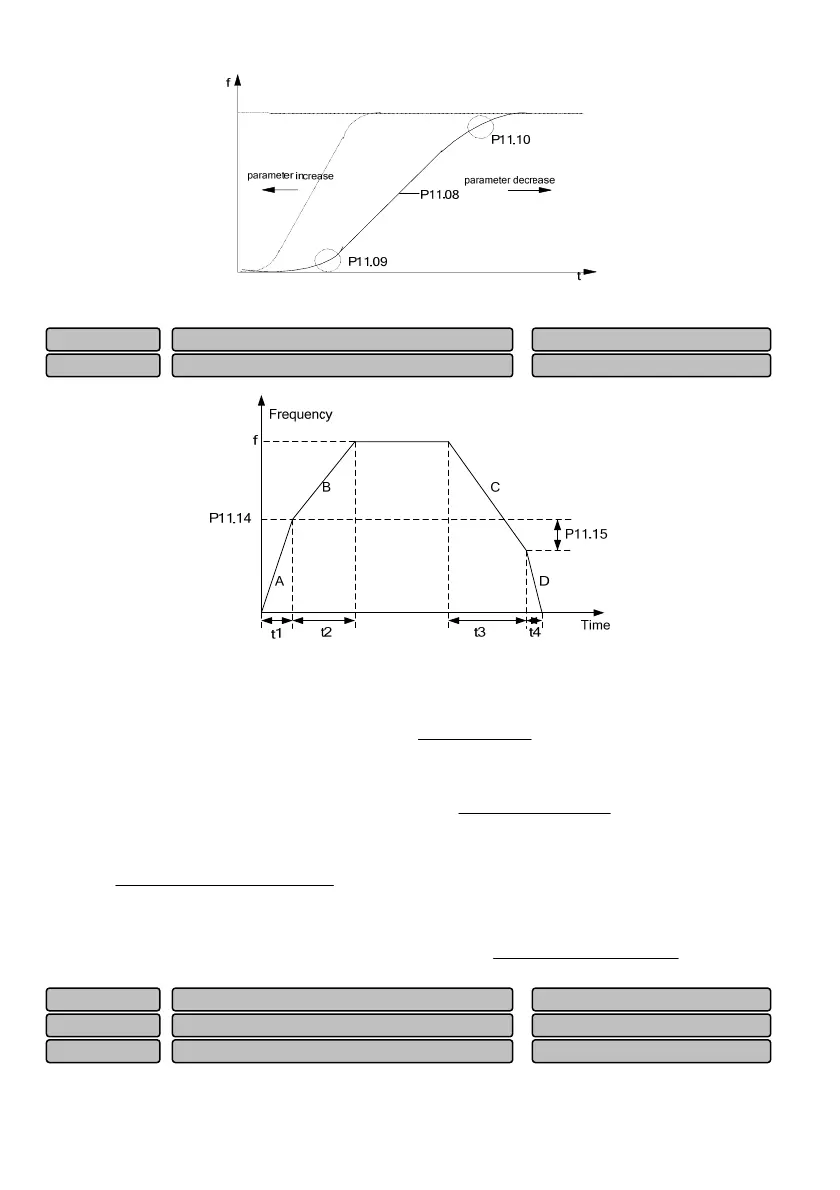
Fig. 6-60 Schematic diagram for switching between acceleration/deceleration time 1 and 2
As shown in Fig. 6-60, for accelerating the motor 1, operate at the acceleration time 1, as the A curve
shown in Fig. 6-60 and the acceleration time
15.02
13.0214.11
1
t
P
PP ×
=
. When the output frequency
increases to the switching point P11.14, the acceleration time will switch from P02.13 to P11.02, as the B
curve shown in Fig. 6-60 and the acceleration time
15.02
02.11)14.11(
2
t
PPf ×−
=
. For deceleration,
operate at the deceleration time 2, as the C curve shown in the figure and
15.02
14.02)15.1114.11(
3
t
FPPf ×+−
=
, until the output frequency decreases to a frequency
(P11.14-P11.15) lower than P11.14, the deceleration time will switch to the deceleration time 1 from 2
switching value, as the D curve shown in the figure, and
15.02
03.11)15.1114.11(
4
t
PPP ×−
=
.
Jo
runnin
fre
uenc
0.10~50.00 Hz
5.00 Hz
P11.18
Jo
interval time 0.0~100.0s
0.0s
P11.17
Jo
acceleration/deceleration time 0.1~60.0s
6.0s
P11.16
Switching hysteresis loop frequency of Acc/Dec time 1 and 2
0.00~655.35Hz
1.00 Hz
P11.15
Switchin
fre
uenc
of Acc
Dec time 1 and 2 0.00~3000.00Hz
0.00 Hz
P11.14
 Loading...