BeneVision N Series Patient Monitor Operator’s Manual 28 - 9
28.9.2.2 Displaying the BIS Trend
The BIS Trend tab of the BIS Expand view shows the trend of selected parameters. You can configure the BIS
trend:
■ Select Parameter 1 and Parameter 2 to set the parameters whose trend you want to display.
■ Set Trend Length.
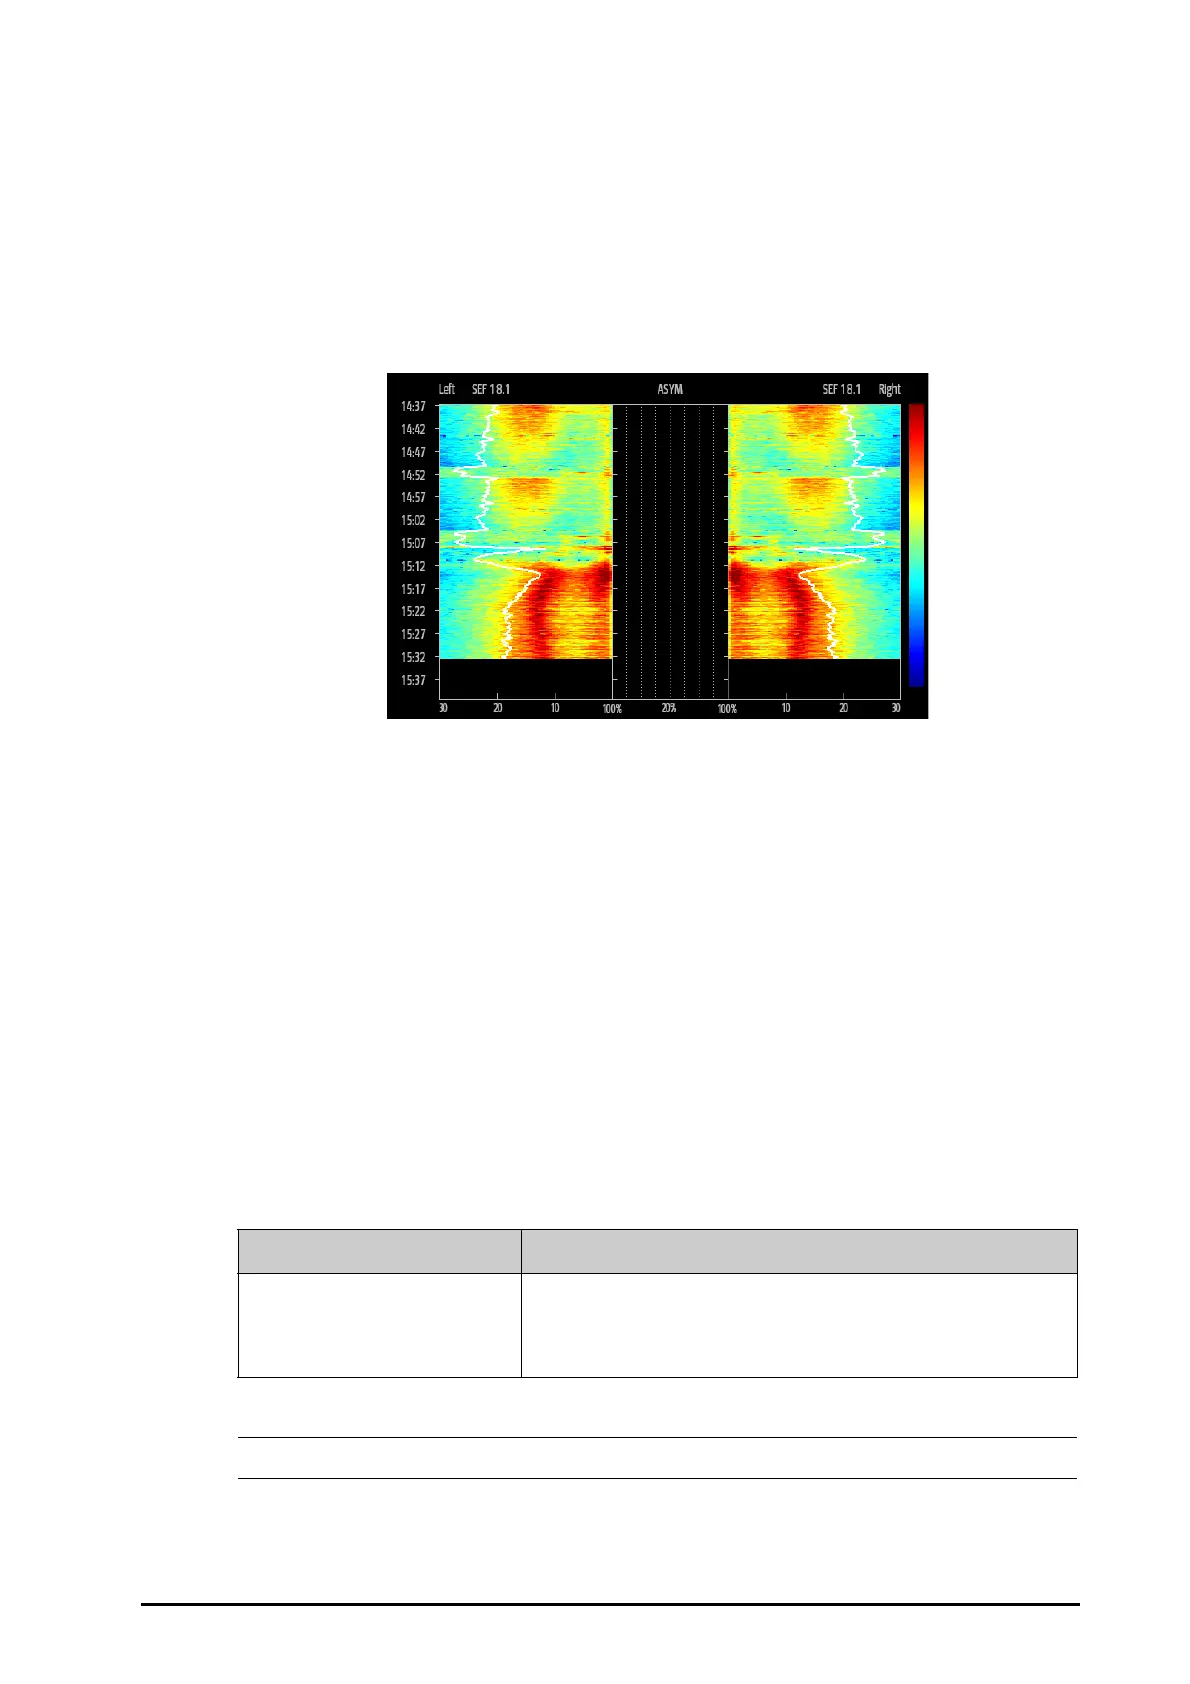
28.9.2.3 Displaying BIS DSA
The Density Spectral Array (DSA) shows changes in the power spectrum distribution over a certain period of time.
DSA view shows the following information:
■ y-axis: time scale
■ x-axis: signal frequency scale from 0 to 30 Hz
■ Color bar: shows range of power. Red indicates maximum power and blue indicates minimum power.
■ Spectral edge frequency (SEF) trend: It is the white Spectral Edge line superimposed on the graph where
95% of the total power lies on one side of the line (toward the inside of the graph) and 5% lies on the other.
■ The current SEF value: displays above the graph.
■ ASYM graph: displays in the center of the DSA view. It shows the degree of asymmetry in EEG power
between the left and right hemispheres. The ASYM scale begins at 20% at the center line and runs left or
right to 100%. Asymmetry data less than 20% are not displayed on the graph, but are available in the
tabular trends.
28.10 BIS Troubleshooting
This section lists the problems that might occur. If you encounter the problems when using the equipment or
accessories, check the table below before requesting for services. If the problem persists after corrective actions
have been taken, contact your service personnel.
• For a comprehensive list of physiological and technical alarm messages, see DAlarm Messages.
Problem Solution
Measurement does not start 1. Check the sensor attachment to the patient and the sensor placement. Check
the sensor contact with skin.
2. Check the sensor type.
3. Check all connections and the patient cable.
 Loading...