List of Figures
xi
List of Figures
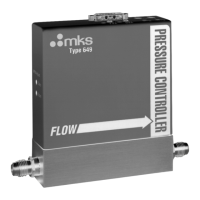
Figure 1: Front View of the Type 649 Controller.......................................................................14
Figure 2: Back View of the Type 649 Controller .......................................................................14
Figure 3: Side View (Inlet) of the Type 649 Controller .............................................................15
Figure 4: Bottom View of the Type 649 Controller....................................................................15
Figure 5: Downstream Pressure Control.....................................................................................17
Figure 6: Top View of the Type 649 Controller.........................................................................21
Figure 7: Location of the Mass Flow Meter Adjustments ..........................................................22
Figure 8: Effects of the Proportional Control .............................................................................25
Figure 9: Effects of the Integral Control.....................................................................................26
Figure 10: Controller Response with Initial P Term and I Term Values....................................27
Figure 11: Controller Response with Increased P Term.............................................................28
Figure 12: Controller Response with Increased I Term..............................................................28
Figure 13: Serial Number Label .................................................................................................31
Figure 14: Jumper Positions on the Transducer Board...............................................................39
Figure 15: Flow Range Selection................................................................................................55


 To Next Page