8.2 FIELD STRENGTH
Narda FieldMan 63
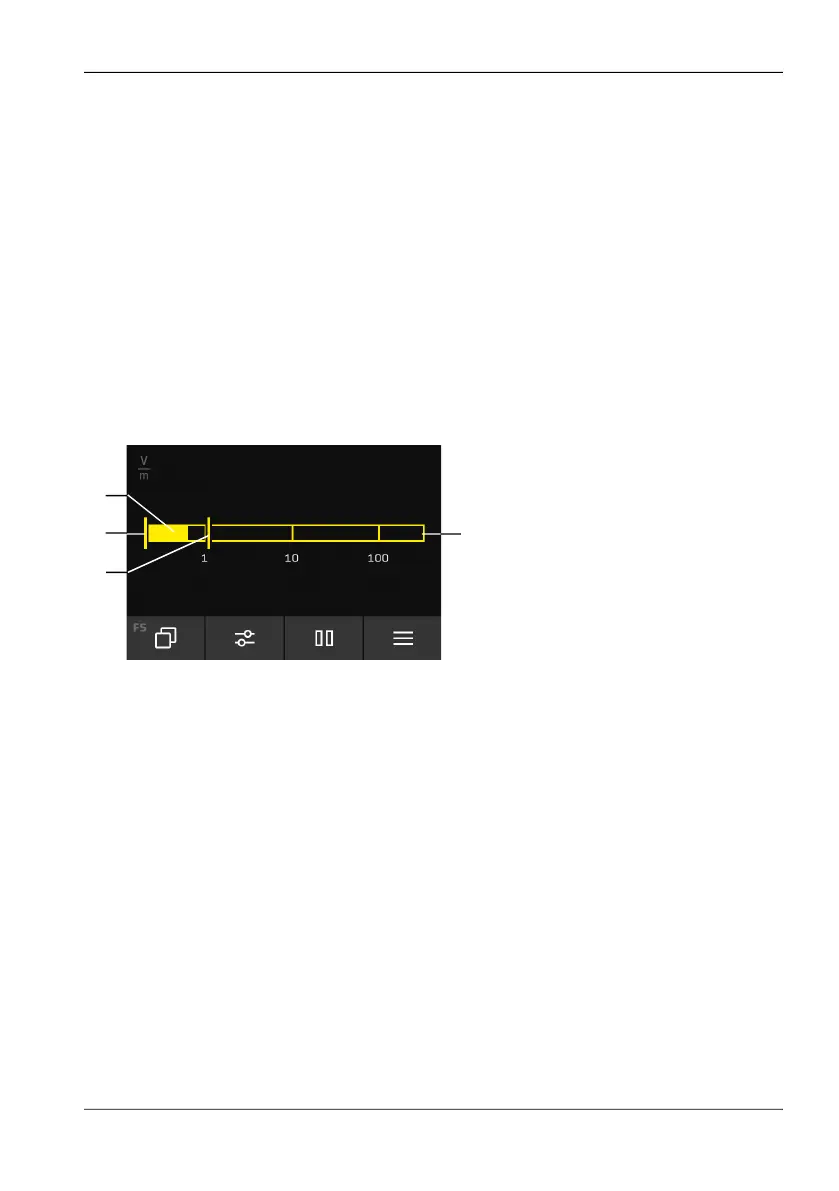
8.2.3 Bar display
The bar represents the ACTUAL values with logarithmic scaling. The left and right limits
are specified by the measuring range limits of the connected probe. MIN and MAX are
displayed as marker lines.
Activate the bar display:
To display the bar graph, the time curve graph must be turned off.
⇒ MEASUREMENT SETTINGS: Deactivate Time Curve.
Start and stop the measurement:
⇒ Press SK3.
The display in detail
Fig. 4: Bar display in the FIELD STRENGTH operating mode
1 Current measured value
2 MIN value
3 MAX value
4 Overall bar scaled to measuring range
1
2
4
3