8 Operating modes
64 FieldMan Narda
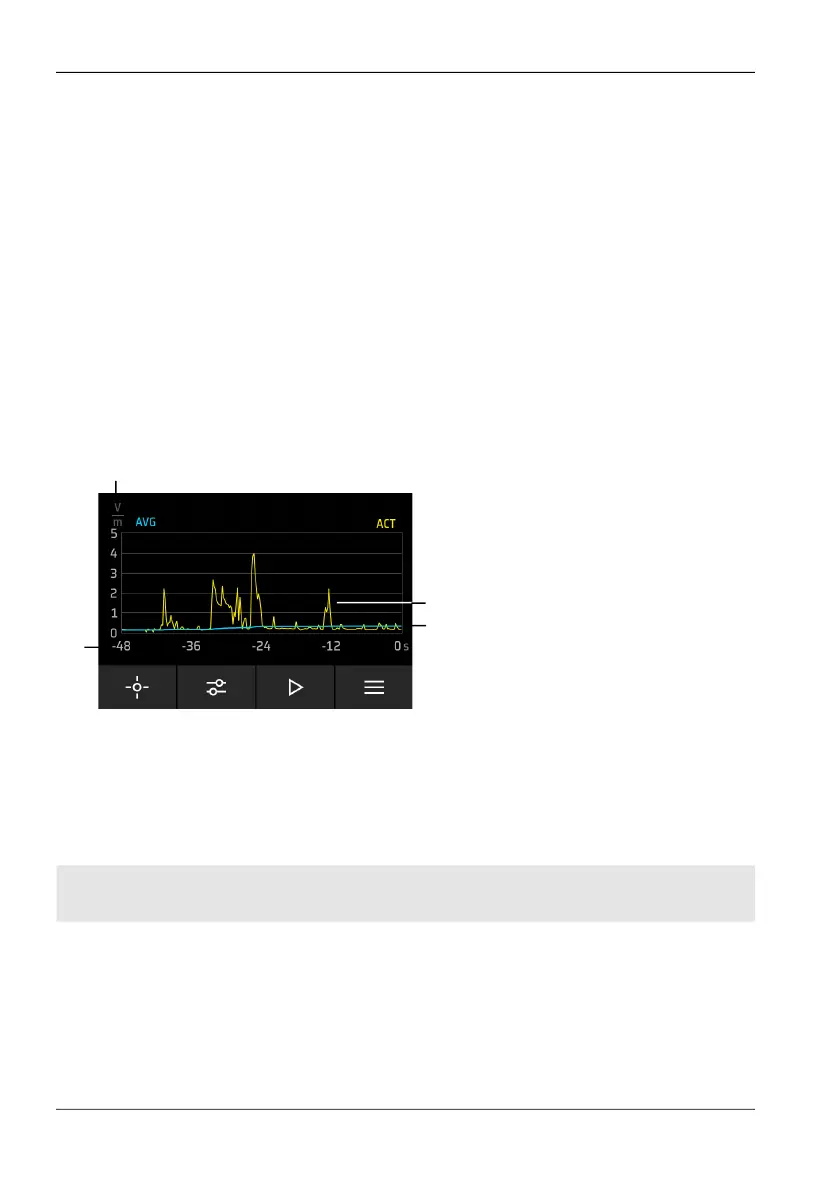
8.2.4 Time curve display
The time curve display shows the isotropic result of the field strength running from right
to left with a rolling memory. The individual axes are not displayed graphically.
Activate the time curve display:
⇒ MEASUREMENT SETTINGS: Activate Time Curve.
↳ Since the curve memory is always active in the FIELD STRENGTH operating
mode (even with Time Curve = Off), the complete curves of ACTUAL and, if ap-
plicable, AVG since the last operating mode change or reset appear imme
diately.
Start and stop the measurement:
⇒ Press SK3.
The display in detail
Fig. 5: Time curve display in the FIELD STRENGTH operating mode
1 Y-axis with automatic scaling
2 X-axis manually adjustable via Time Span
3 Yellow curve: Time curve of the current measured values (ACTUAL)
4 Blue curve: Time curve of the averaged measured values (AVG)
The display of the AVG curve is omitted if the peak detector was selected instead of
the RMS detector for LF probes.
1
4
3
2