47
3.2 TraceDrawer Analysis
The procedure below demonstrates the analysis of real data from OpenSPR
TM
experiments using the
most commonly used TraceDrawer functions.
3.2.1 Import data into TraceDrawer
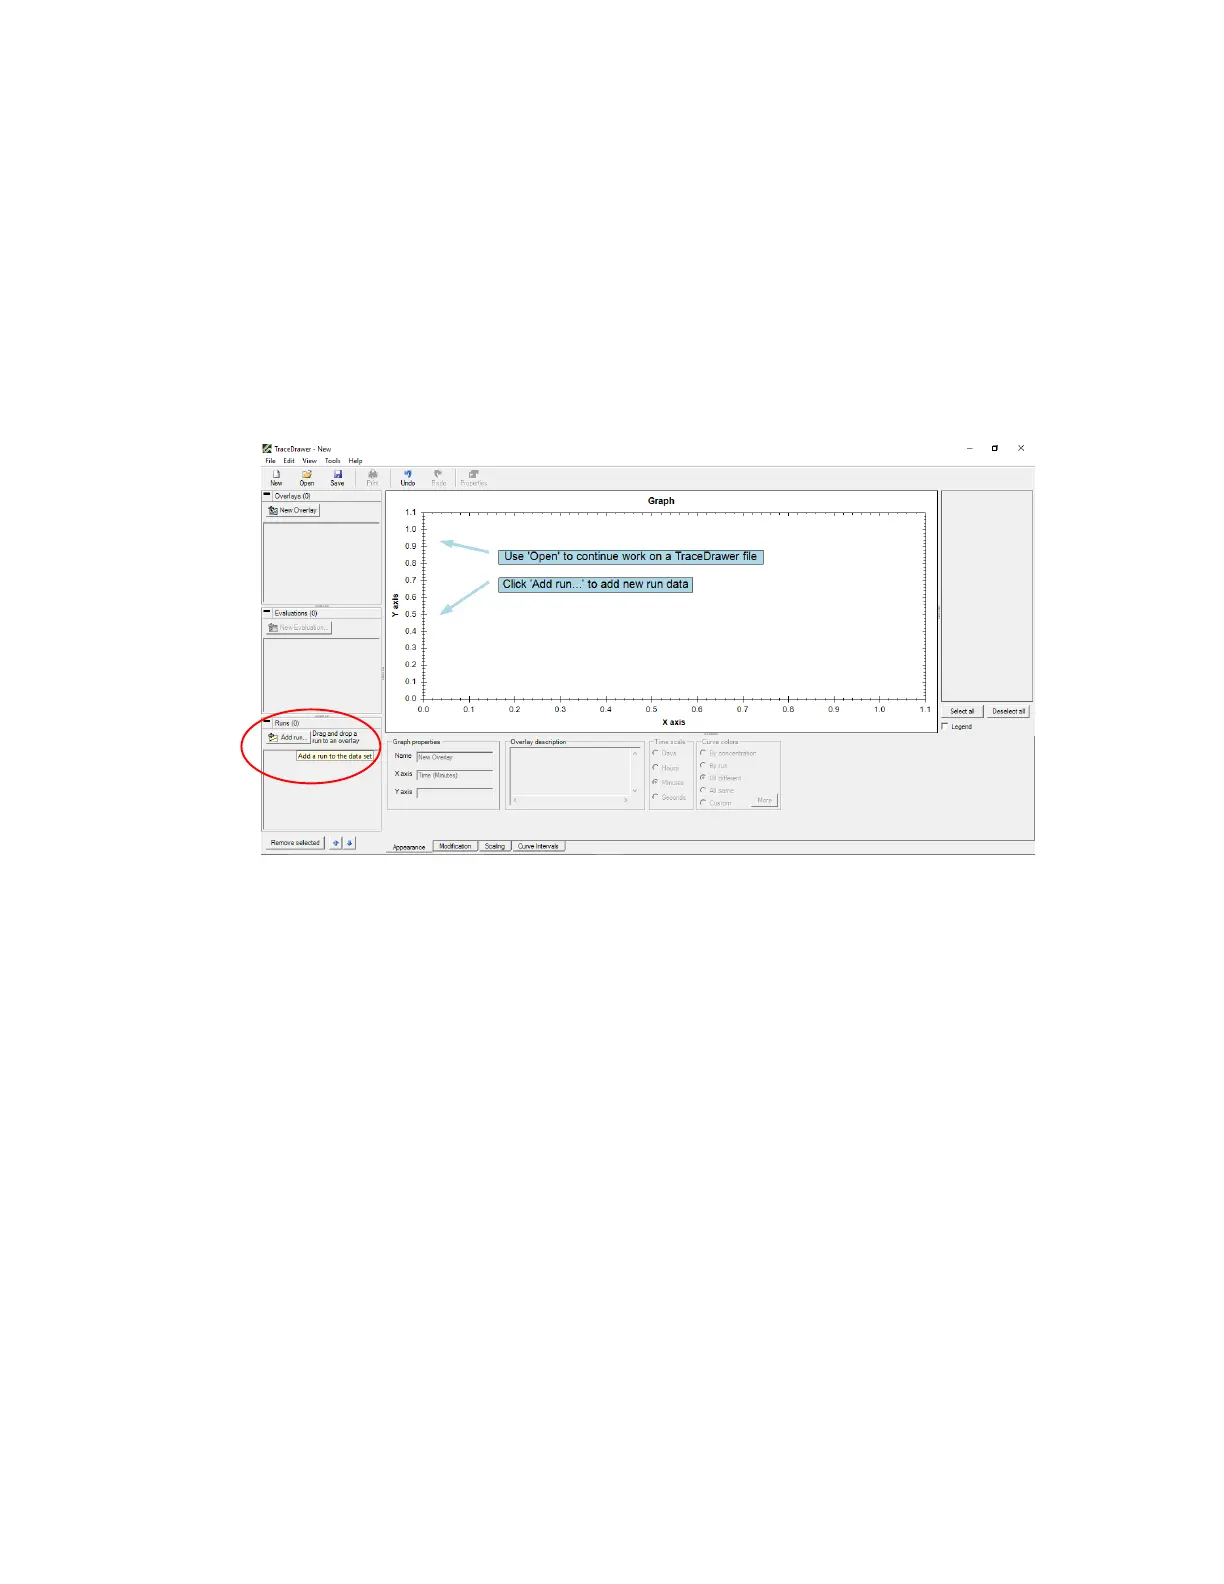
1. Open TraceDrawer software and click Add run to import TestName_TraceDrawerExport.txt file
[Figure 3.2].
Figure 3.2 - TraceDrawer start page with Add Run button highlighted.
2. Check mark all curves to be included in TraceDrawer analysis and modify run properties. Run
name and description can be added (left of graph). Curve names and concentrations can be
changed by clicking on the corresponding cell below the graph [Figure 3.3]. Specify the
concentrations of the analyte injections in this screen. Concentrations must be specified in molar
units (M). For example, if a concentration of 6.5 nM was used, it can be input using the SI unit
prefix as “6.5n”, or a concentration of 7.2 µM can be input as “7.2u”.