48
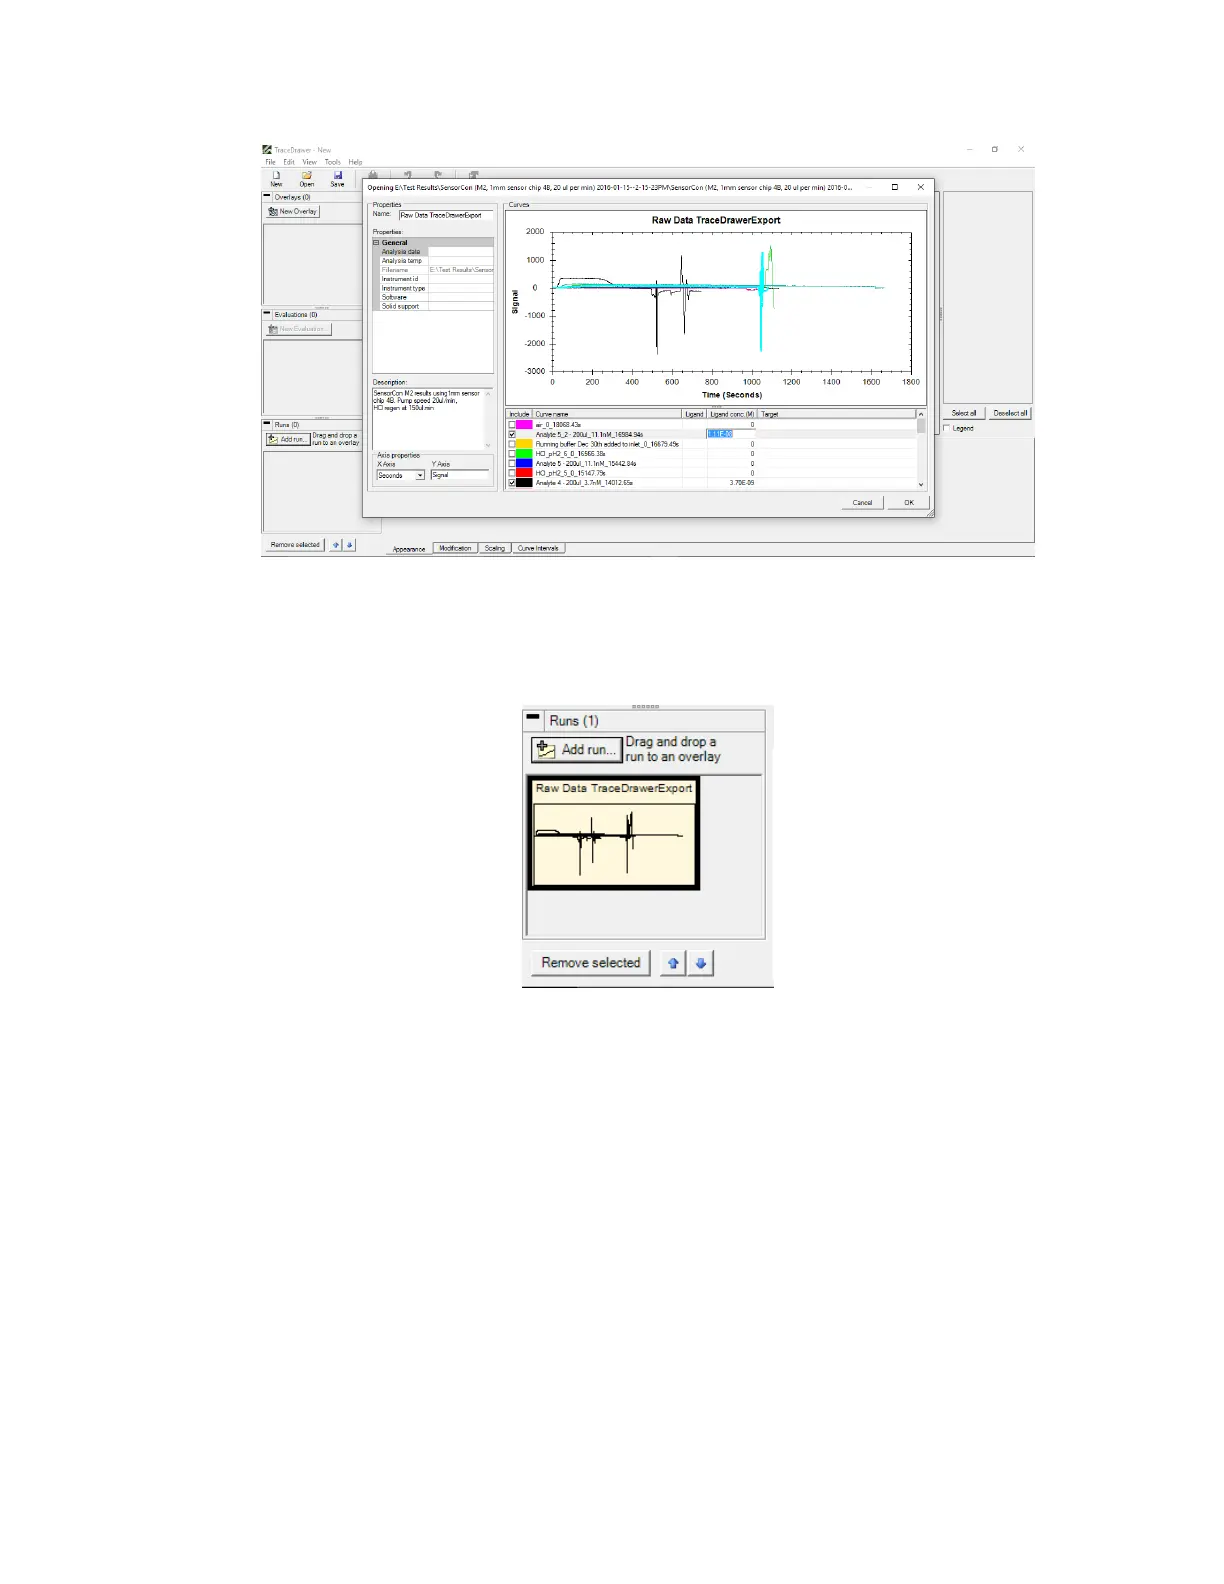
Figure 3.3 - TraceDrawer Add Run menu where can add run name, description, curve names and sample concentrations.
Click OK to add the run. This will be shown as a thumbnail in the bottom left corner of the
window [Figure 3.4].
Figure 3.4 - OpenSPR data shown as a thumbnail in the run section (bottom left corner).
3. Create an overlay by clicking New Overlay. Then left click and drag a run to an overlay [Figure
3.5].